//o\\ Work In Progress //o\\
(Preliminary) Conclusion: 4 of the 5 claims check out so far (with caveats based on imperfect data sets), based on referenced crime data provided by the DOJ and FBI. (Still working on the final claim)
This page links and discusses their sources and methods: About RAINN's statistics.
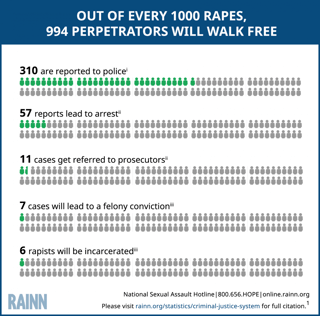
Let's break the graphic down into its individual components:
Claim 1: 31% of rapes are reported to the police (310 of 1000)
RAINN says this statistic is calculated by averaging the 5 most recent years of available data from the US DOJ's "Criminal Victimization" report. Let's see if that stacks up.
Here is what I found for "Percent of victimizations reported to police" for Rape/sexual assault (all links are PDFs):
- 2012: 28.2% (2013 report, Page 7, Table 6)
- 2013: 34.8% (2013 report, Page 7, Table 6)
- 2014: 33.6% (2014 report, Page 7, Table 6)
- 2015: 32.5% (2015 report, Page 6, Table 4)
- 2016: 22.9% (2016 report, Page 7, Table 5)
Averaging these 5 values gives 30.4%, so the calculation seems accurate.
Nitpick: The "Rape/sexual assault" crime category in the DOJ reports is fairly broad (it includes attempted rape, other kinds of sexual assault, and even threats of rape), so this particular source doesn't differentiate between the reporting percentage of each of these smaller sub-groups (if there is any difference).
I found another (earlier) source that does distinguish between them, and the numbers aren't out of line. The BJS report "Rape and Sexual Assault: Reporting to Police and Medical Attention, 1992-2000" reports the following in Table 3:
- Completed Rape: 36% reported to police
- Attempted Rape: 34% reported to police
- Sexual assault: 26% reported to police
31% still seems like a reasonable number.
Claim 2: 18% of reports lead to arrest (57 of 310)
This stat comes from the FBI National Incident-Based Reporting System, which collects crime data from states and local agencies.
This is my speculation, but they might have used the "Incidents Cleared by Offense Category, 2015" report for crimes in the category "Sex Offenses":
- Total incidents: 70,788
- Cleared by Arrest: 12,431
- Cleared by "Exceptional Means": 7,679
"Cleared by Arrests" / "Total incidents" works out to 17.6%, which is close to RAINN's figure.
Nitpick: What is a little unclear for this stat is whether the other column, "cleared by exceptional means" should count. According to the accompanying description, these cases were "cleared" (solved) in some other way:
When an incident is cleared by exceptional means, it was cleared in some other way than by arrest, i.e., the death of the offender, prosecution was declined for other than lack of probable cause, the offender was already in custody in another jurisdiction, the victim refused to cooperate in the prosecution, or the offender was a juvenile and the crime was handled without taking him/her into custody.
Some of these scenarios may be viewed as a "positive outcome" by the victim (if the offender is already in jail for another crime, for example), others would not. Strictly speaking, though, if they aren't prosecuted for this crime, the chart may be correct to exclude them (especially since we can't distinguish which is which).
Claim 3: 19% of arrests are referred to a prosecutor (11 of 57)
(Still working on this one, although this data does not appear to be in the FBI NIBRS data. In fact, I found a page that explicitly says that the FBI UCR program doesn't collect data on the number of persons who were prosecuted, convicted, and/or imprisoned.)
Claim 4: 64% of prosecutions lead to a felony conviction (7 of 11)
This one goes back to the BJS data, thanks for pinpointing the source, @BobTheAverage.
The Felony Defendants in Large Urban Counties report for 2009 (page 24, Table 21) shows a felony conviction rate of 57% for rape.
57% of 11 (in the chart) is 6.3, so rounding that up to 7 seems reasonable.
Nitpick: This report is for the 75 largest counties in the US, not for the entire US population. (This isn't cherry-picking, this report is the only one of this type available.) Clearly urban and rural counties will have different crime patterns; the question here is whether the rates of conviction and incarceration are similar, even if the volume is different.
Claim 5: 85% of felony convictions involve jail time (6 of 7)
From the same report (Page 29, Table 24), 89% of convictions for rape result in jail time.
This is very close to chart value of 85%.
Nitpick: (See nitpick on Claim 4)

