7

Twitter user, @APhilosophae, with 24K followers, recently published a Twitter thread detailing an analysis of voting patterns in the recent US presidential election.

They argue that most states the proportion of votes between Trump and Biden remained approximately constant throughout the later parts of the count, which they attribute to the shuffling of mailed ballots.

The initial reporting represents in-person voting. These vote reports have such large variation bc in-person voting happens across different geographic areas that have different political alignments. We can see this same pattern of noisy in-person voting, followed by homogeneous mail-in reporting in almost all cases.

[...]

The reason they're so homogeneous across with respect to the ratio of #Biden vs #Trump votes is that they get randomly shuffled in the mail... like a deck of cards. Since the ballots are randomly mixed together during transport, spanning areas occupied by multiple voting demographics, we can expect the ratio of mail-in #Biden ballots to mail-in #Trump ballots will remain relatively constant over time...

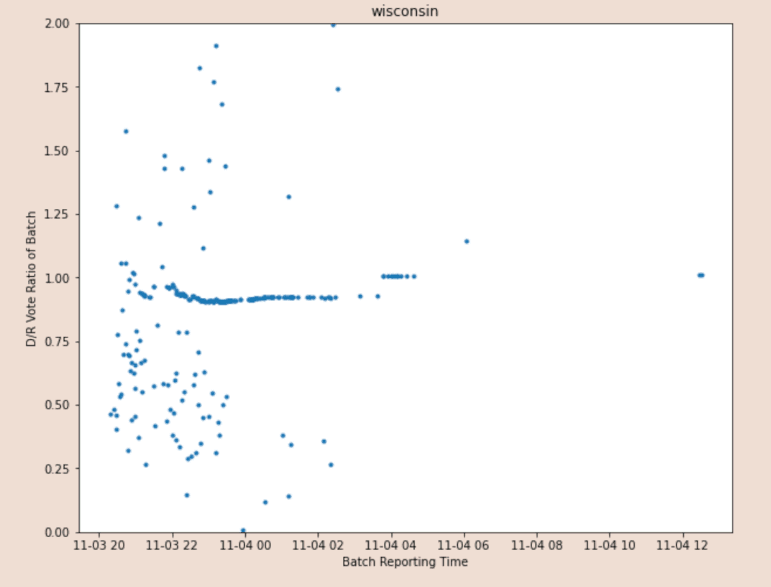
They then point to Wisconsin voting and claim there is an anomaly at 4am:

Graph of Wisconsin votes over time

More allegations of anomalies are made about Georgia, Michigan, Virginia and Pennsylvania voting.

It appears Dems shot themselves in the foot bc making everyone do mail-in ballots actually makes it easier to catch mail-in ballot fraud. Bc all of the ballots go through the postal system, they get shuffled like a deck of cards, so we expect reported... ballot return to be extremely UNIFORM in terms of D vs R ratio, but to drift slightly towards R over time bc some of those ballots travel farther. This pattern proves fraud and is a verifiable timestamp of when each fraudulent action occurred.

Are these apparent anomalies present in the voting data, and do they indicate potential voter fraud?

2
  • 3
    Asking if there are any anomalies at all isn't falsifiable. You don't mention a specific claim here. Let's focus this into somethng answerable, including cites of an actual claim.
    – Oddthinking
    Commented Nov 9, 2020 at 14:51
  • 1
    Welcome to Skeptics! We require questions on this site to be about widely-believed ("notable") claims. Some users confuse that with claims coming from sources that they consider reliable. The source of this question's claim might not be considered reliable, but they are widely read. I have deleted comments that insist on reliable sources for this question. (Answers, of course, should use reliable sources.)
    – Oddthinking
    Commented Nov 9, 2020 at 20:45

3 Answers 3

22

The key assumption,

the ballots are randomly mixed together during transport, spanning areas occupied by multiple voting demographics, we can expect the ratio of mail-in #Biden ballots to mail-in #Trump ballots will remain relatively constant over time...

Is false. Ballots are mailed to local election offices and not to a central state-wide office, and they were counted by local election offices. You can see, for instance, by reviewing FiveThirtyEight's live blog of the election, that essentially every time a batch was released, it was released from a particular county. This is not consistent with the claim's assertion that ballots were all mixed together across areas. Despite the fact that they were mailed, ballots remained grouped by location. Different localities obviously have different demographics.

In addition, some places have separated ballots by time of arrival. This is the case, for instance, in Maricopa County in Arizona* and all of Pennsylvania. This is additional evidence that the claim that all mailed ballots are mixed together is not true in general.

We cannot expect all batches of counts released later to be samples from the same homogenized batch of ballots. These are clear examples available of meaningful ways that mail-in ballots remained partitioned with respect to the demographics they came from. It is not an anomaly that actual data differs from the claim's faulty assumption of homogeneity.

* The relevant quote from this article is:

In Maricopa County, the early ballots include those processed by Sunday ... After the early ballots vote totals, county officials count ballots cast at the polls on Election Day ... there are still hundreds of thousands of votes to be tallied, including the "late" early votes — those that arrive after the county stops processing early ballots or those that are dropped off on Election Day.

5
  • 5
    Please provide some references to support your claims.
    – Oddthinking
    Commented Nov 10, 2020 at 6:37
  • 2
    @Oddthinking I've added some. Is this better? Commented Nov 10, 2020 at 15:28
  • 4
    No. You seem to be claiming that in the states of Georgia, Michigan, Virginia and Pennsylvania that (a) ballots are mailed to local offices, (b) batched up and send to a central office to be counted on election night, and (c) the counting proceeds before all have arrived, but not before the polls close. At the same time, you are claiming that this is not true for the other states mentioned. One county isn't sufficient. A video of a car isn't sufficient.
    – Oddthinking
    Commented Nov 10, 2020 at 15:57
  • 2
    @Oddthinking I'm not claiming most of the things you appear to think I am. I'll have to work on making myself more clear. Commented Nov 10, 2020 at 16:11
  • 13
    @Oddthinking I've reviewed all the edits, and I can't see anything that says what you claim. I think you may have misread.
    – barbecue
    Commented Nov 10, 2020 at 18:15
15

The "anomalies" are a logical consequence of the data analysis

(This answer is based of this Twitter thread that explains what is going on.)

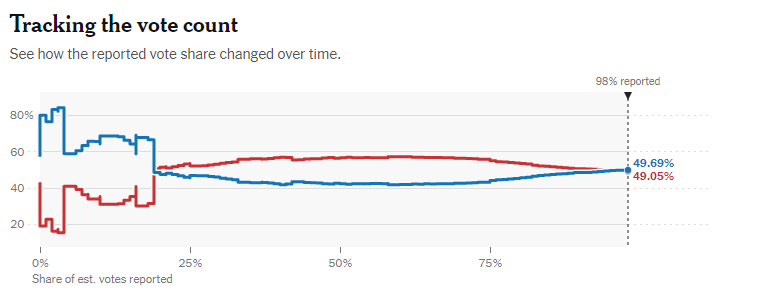
To understand what is happening we first have to look at how the data that is being analyzed was generated. The data was scraped of the NY Times website by looking at the values of graphs like this: enter image description here

This gives (for each state) a time series that has at each update time:

  • The time of the update
  • The total number of votes counted
  • The percentage of votes for Biden
  • The percentage of votes for Trump

From this "raw" data, the Twitter poster tries to infer the number of votes cast for Biden and Trump in each update. This is done by first multiplying the total votes by the percentage for each candidate, to get the total votes for each candidate at each update. The number votes cast for each candidate at each update is then inferred by comparing to the previous total.

This would be exactly how to do this if the data used was exact. However, the crucial thing to note is that the percentages scraped are rounded to the nearest multiple of 0.1%. This means that updates that add a number of votes that is smaller than 0.1% of the total number of votes already counted, then this update will not change the scraped percentages for each candidate, and there is no way to infer how the votes in the update were split for each candidate.

This however is ignored in the way the data is reverse engineered. The method for calculating the votes cast for each candidate will, in these cases, simply return a split of the votes in these small updates that is equal to the current split of the total vote at the time of the update.

This explains the appearance of a continuous looking line in the time series data for each state. As the counting progresses an increasing fraction of updates will be too small for the reverse engineering to resolve, and be assigned the current average. This average can slowly drift as the balance of the race changes. Or it can suddenly jump if there is one update that significantly changes the balance of the race. This was the case in Wisconsin, where around 4 a massive update of 170k counted absentee ballots from Milwaukee was reported that leaned heavily towards Biden (see here for example).

So, in short this analysis did not show anomalies in the voting, but rather anomalies in the procedure used to reverse engineer the voting data from the NY Times graphs, caused by rounding error.

2
  • 1
    Good on you for examining the actual methodology! That's a serious error you've uncovered. Commented Nov 11, 2020 at 13:59
  • 1
    @AlphaDraconis The credit for that goes to cb_miller on Twitter!
    – TimRias
    Commented Nov 11, 2020 at 14:01
6

The Claim Is Based On Unsupported Assumptions

They seem to be well-meaning. They do provide their data set (though we don't know the source nor if it's valid data) and analysis software. However, their analysis relies on on a series of assumptions while providing little evidence those assumptions are correct. Without verifying their assumptions their analysis is meaningless.

Here's the most critical assumption.

What appears to be happening is that points on the straight line are actually mail in votes.

and

The initial reporting represents in-person voting...

This claim is never supported. It needs strong support because everything rests on it, and because different states count votes differently. Some will begin counting mail and early ballots before election day. For example, Florida began counting October 12th while Pennsylvania had to wait until Election Day.

Everything follows from this assumption. The assumption is unsupported, so a detailed analysis of the rest of the claim is moot. Let's skip to their summary.

[Because] all of the ballots go through the postal system, they get shuffled like a deck of cards, so we expect reported ballot return to be extremely UNIFORM in terms of [Democrat] vs [Republican] ratio, but to drift slightly towards R over time [because] some of those ballots travel farther.

They offer no evidence for this assumption. Alpha Draconis explains why the "randomly shuffled in the mail" hypothesis is not true.

but to drift slightly towards [Republican] over time [because] some of those ballots travel farther. This pattern proves fraud and is a verifiable timestamp of when each fraudulent action occurred.

This rests on two unsupported assumptions.

  • Republicans tend to be further away from polling centers.
  • When your vote is reported is based on your distance to a polling center.

Both must be shown to be true across all states in question.

Broad Generalizations to State and Counties

A general problem with the claim is it applies broad generalizations across states and counties. Voting, counting, and reporting vary state-by-state, and even county-by-county. The assumptions would have to be confirmed for each state and county.

Is Linear Regression Surprising?

As we can see on this log-log plot, for many of the counting progress updates, we see an almost constant ratio of #Biden to #Trump. It's such a regular pattern that we can actually fit a linear regression model to it with near-perfect accuracy, barring some outliers.

How could this be possible? Is this a telltale sign of fraud? Surprisingly, as it will be shown, the answer is no! This is actually expected behavior. Also, we can use this weird pattern in the ballot counting to spot fraud!

Source

I find their surprise odd. I'm not a statistician, but I would expect a tight race to average out to roughly the amount of votes for each candidate over time.

Their unsupported claim that this is a "weird pattern" leads to their hunt to find an explanation for why it is there. If it isn't a "weird pattern", there's no need to hunt for an explanation.

Delivering Results is not Accepting Ballots.

Around 3am Wisconsin time, a fresh batch of 169k new absentee ballots arrived. They were supposed to stop accepting new ballots, but eh, whatever I guess.

Source

They have mistaken delivering results with continuing to accept ballots. From The Hill...

A Milwaukee election official delivered absentee ballot information with the help of a police escort early Wednesday as officials worked to report ballot results in Wisconsin amid a tight battle between President Trump and former Vice President Joe Biden.

While this mistake does not directly affect their claim, making such an elementary mistake about how voting works does not inspire confidence in their analysis.

You must log in to answer this question.

Not the answer you're looking for? Browse other questions tagged .