The Claim Is Based On Unsupported Assumptions
They seem to be well-meaning. They do provide their data set (though we don't know the source nor if it's valid data) and analysis software. However, their analysis relies on on a series of assumptions while providing little evidence those assumptions are correct. Without verifying their assumptions their analysis is meaningless.
Here's the most critical assumption.
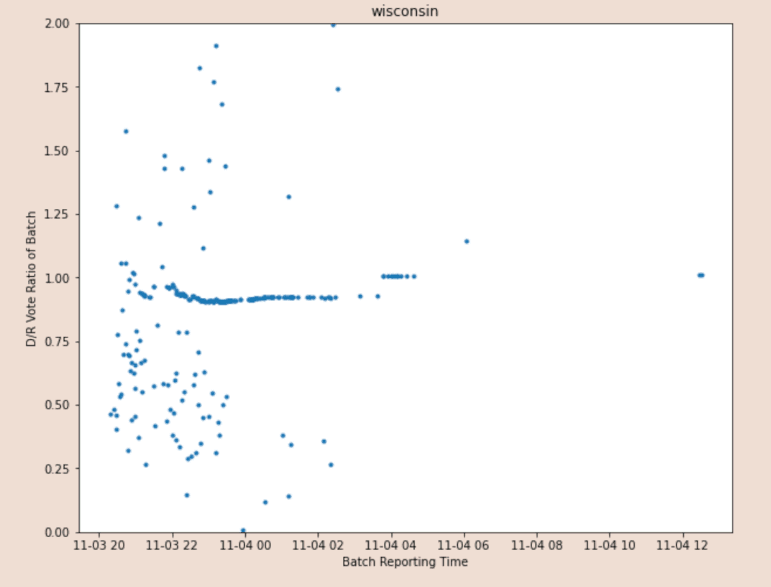
What appears to be happening is that points on the straight line are actually mail in votes.
and
The initial reporting represents in-person voting...
This claim is never supported. It needs strong support because everything rests on it, and because different states count votes differently. Some will begin counting mail and early ballots before election day. For example, Florida began counting October 12th while Pennsylvania had to wait until Election Day.
Everything follows from this assumption. The assumption is unsupported, so a detailed analysis of the rest of the claim is moot. Let's skip to their summary.
[Because] all of the ballots go through the postal system, they get shuffled like a deck of cards, so we expect reported ballot return to be extremely UNIFORM in terms of [Democrat] vs [Republican] ratio, but to drift slightly towards R over time [because] some of those ballots travel farther.
They offer no evidence for this assumption. Alpha Draconis explains why the "randomly shuffled in the mail" hypothesis is not true.
but to drift slightly towards [Republican] over time [because] some of those ballots travel farther. This pattern proves fraud and is a verifiable timestamp of when each fraudulent action occurred.
This rests on two unsupported assumptions.
- Republicans tend to be further away from polling centers.
- When your vote is reported is based on your distance to a polling center.
Both must be shown to be true across all states in question.
Broad Generalizations to State and Counties
A general problem with the claim is it applies broad generalizations across states and counties. Voting, counting, and reporting vary state-by-state, and even county-by-county. The assumptions would have to be confirmed for each state and county.
Is Linear Regression Surprising?
As we can see on this log-log plot, for many of the counting progress updates, we see an almost constant ratio of #Biden to #Trump. It's such a regular pattern that we can actually fit a linear regression model to it with near-perfect accuracy, barring some outliers.
How could this be possible? Is this a telltale sign of fraud? Surprisingly, as it will be shown, the answer is no! This is actually expected behavior. Also, we can use this weird pattern in the ballot counting to spot fraud!
Source
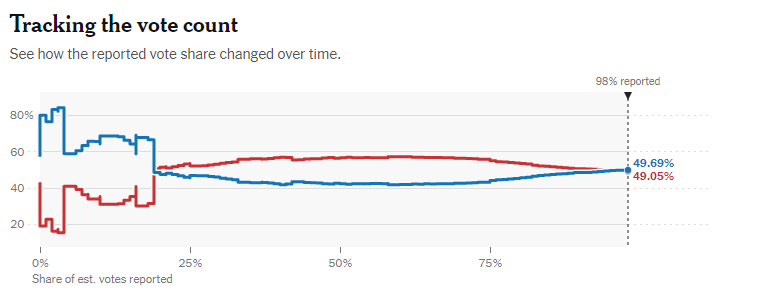
I find their surprise odd. I'm not a statistician, but I would expect a tight race to average out to roughly the amount of votes for each candidate over time.
Their unsupported claim that this is a "weird pattern" leads to their hunt to find an explanation for why it is there. If it isn't a "weird pattern", there's no need to hunt for an explanation.
Delivering Results is not Accepting Ballots.
Around 3am Wisconsin time, a fresh batch of 169k new absentee ballots arrived. They were supposed to stop accepting new ballots, but eh, whatever I guess.
Source
They have mistaken delivering results with continuing to accept ballots. From The Hill...
A Milwaukee election official delivered absentee ballot information with the help of a police escort early Wednesday as officials worked to report ballot results in Wisconsin amid a tight battle between President Trump and former Vice President Joe Biden.
While this mistake does not directly affect their claim, making such an elementary mistake about how voting works does not inspire confidence in their analysis.


