Notice removed Comments only by CommunityBot
Post Unlocked by CommunityBot
Tweeted twitter.com/StackSkeptic/status/1328533527802097664
Post Locked by Oddthinking
Notice added Comments only by Oddthinking
Post Reopened by Oddthinking
added 1710 characters in body
Source Link
Oddthinking
  • 144.7k
  • 48
  • 564
  • 655

Are there significantthese anomalies in time series data ofthe Biden-Trump vote ratiosdata indicative of voter fraud?

Twitter user, @APhilosophae, with 24K followers, recently published a This Twitter accountTwitter thread has posted a fairly convincing-looking setdetailing an analysis of plotsvoting patterns in the recent US presidential election.

They argue that most states the proportion of votes between Trump and Biden remained approximately constant throughout the later parts of the count, which they useattribute to claim some of the vote tallies have been fabricatedshuffling of mailed ballots. It's very longwinded (which I assume

The initial reporting represents in-person voting. These vote reports have such large variation bc in-person voting happens across different geographic areas that have different political alignments. We can see this same pattern of noisy in-person voting, followed by homogeneous mail-in reporting in almost all cases.

[...]

The reason they're so homogeneous across with respect to the ratio of #Biden vs #Trump votes is that they get randomly shuffled in the mail... like a deck of cards. Since the ballots are randomly mixed together during transport, spanning areas occupied by multiple voting demographics, we can expect the ratio of mail-in #Biden ballots to mail-in #Trump ballots will remain relatively constant over time...

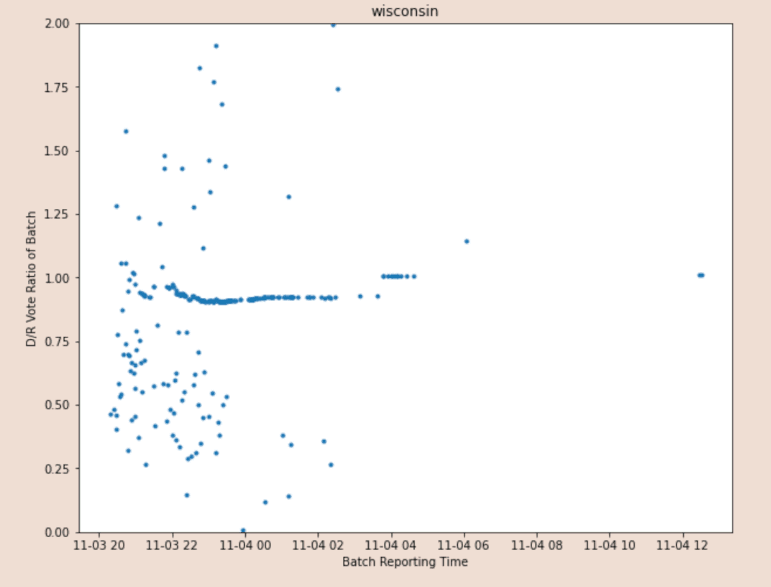
They then point to Wisconsin voting and claim there is a tactic).an anomaly at 4am:

Graph of Wisconsin votes over time

A friendMore allegations of mine (who badly wishes to see Trump re-elected) shared it with meanomalies are made about Georgia, Michigan, Virginia and I'm wondering if anyone can see what I'm missingPennsylvania voting.

It appears Dems shot themselves in the foot bc making everyone do mail-in ballots actually makes it easier to catch mail-in ballot fraud. Bc all of the ballots go through the postal system, they get shuffled like a deck of cards, so we expect reported... ballot return to be extremely UNIFORM in terms of D vs R ratio, but to drift slightly towards R over time bc some of those ballots travel farther. This pattern proves fraud and is a verifiable timestamp of when each fraudulent action occurred.

Are these apparent anomalies present in the voting data, and do they indicate potential voter fraud?

Are there significant anomalies in time series data of Biden-Trump vote ratios?

This Twitter account has posted a fairly convincing-looking set of plots which they use to claim some of the vote tallies have been fabricated. It's very longwinded (which I assume is a tactic).

A friend of mine (who badly wishes to see Trump re-elected) shared it with me and I'm wondering if anyone can see what I'm missing?

Are these anomalies in the Biden-Trump vote data indicative of voter fraud?

Twitter user, @APhilosophae, with 24K followers, recently published a Twitter thread detailing an analysis of voting patterns in the recent US presidential election.

They argue that most states the proportion of votes between Trump and Biden remained approximately constant throughout the later parts of the count, which they attribute to the shuffling of mailed ballots.

The initial reporting represents in-person voting. These vote reports have such large variation bc in-person voting happens across different geographic areas that have different political alignments. We can see this same pattern of noisy in-person voting, followed by homogeneous mail-in reporting in almost all cases.

[...]

The reason they're so homogeneous across with respect to the ratio of #Biden vs #Trump votes is that they get randomly shuffled in the mail... like a deck of cards. Since the ballots are randomly mixed together during transport, spanning areas occupied by multiple voting demographics, we can expect the ratio of mail-in #Biden ballots to mail-in #Trump ballots will remain relatively constant over time...

They then point to Wisconsin voting and claim there is an anomaly at 4am:

Graph of Wisconsin votes over time

More allegations of anomalies are made about Georgia, Michigan, Virginia and Pennsylvania voting.

It appears Dems shot themselves in the foot bc making everyone do mail-in ballots actually makes it easier to catch mail-in ballot fraud. Bc all of the ballots go through the postal system, they get shuffled like a deck of cards, so we expect reported... ballot return to be extremely UNIFORM in terms of D vs R ratio, but to drift slightly towards R over time bc some of those ballots travel farther. This pattern proves fraud and is a verifiable timestamp of when each fraudulent action occurred.

Are these apparent anomalies present in the voting data, and do they indicate potential voter fraud?

edited tags
Link
Oddthinking
  • 144.7k
  • 48
  • 564
  • 655
Post Closed as "Needs more focus" by jeffronicus, Oddthinking
Source Link

Are there significant anomalies in time series data of Biden-Trump vote ratios?

This Twitter account has posted a fairly convincing-looking set of plots which they use to claim some of the vote tallies have been fabricated. It's very longwinded (which I assume is a tactic).

A friend of mine (who badly wishes to see Trump re-elected) shared it with me and I'm wondering if anyone can see what I'm missing?