11

In the YouTube video The WAR on MEN is total government misinformation, John Cadogan makes the claim that "One in four victims of intimate partner homicide in Australia are male."

He gives a link to statistics on homicide from the Australian Institute of Criminology but I'm not sure how to get from that page to his claim.

In terms of notability, this YouTube channel has around 390K subscribers.

3
  • 5
    FYI, you can link to a specific timestamp in a YouTube video by adding e.g. &t=807 to the back of your link.
    – shoover
    Commented May 20 at 16:00
  • By the way this doesn't surprise me. It's a common pattern that a male partner abuses and controls a female partner to the point where she believes she cannot get away from him, despite the abuse. Then she decides the only way out is to kill him. Commented Jun 21 at 16:56
  • @DJClayworth do you have any claims I can refer to so I can get that one tested? I looked a bit further about half of the situations involved domestic abuse it did not give the nature of it though in terms of who was initiating it. Commented Jun 22 at 18:29

2 Answers 2

40

Summary:

The claim is not strictly true for the most recent year (2022-2023).

However, it was true for the previous year used by the claimant, and has been true, on average, for the past 34 years.


The most recent report from the Australian Institute of Criminology is Homicide in Australia 2022–23.

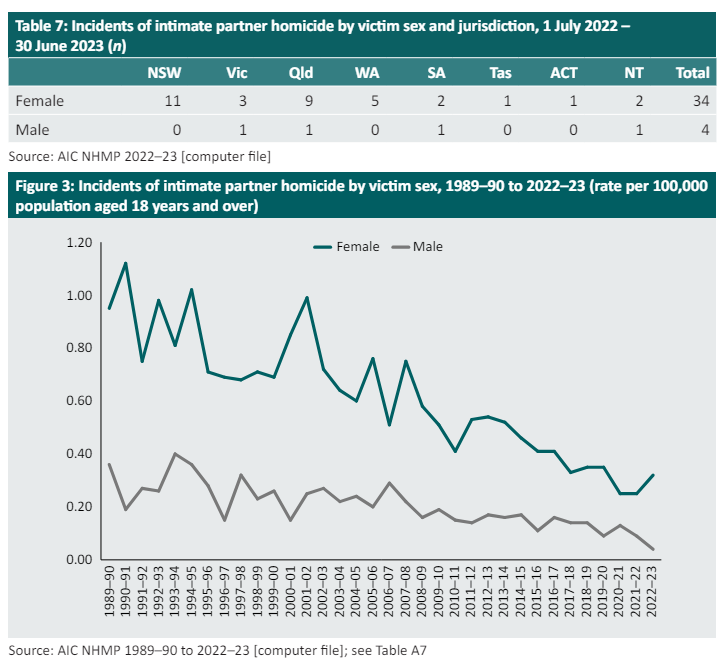
On page 11, there is a relevant chart and figure:

Figure showing the number of intimate partner homicides by sex

The chart is very similar to the one shown by John Cadogan, but extends a further year. There is a slight jump in the data, and the chart confirms - with 4 male victims of 38 relevant homicides, the ratio in the most recent year shown is closer to 1 in 9.

(I believe they are using July-June financial years, rather than calendar years, but I haven't been able to confirm that.)

However, if we look at the raw data (Excel spreadsheet) used to generate the graph, we can see in Table A7, the 2021-2022 period used by Cadogan has 9 male victims from a total of 35 - slightly over 1 in 4.

Looking at the entire history, from 1989-2023, we can see the total male victims was 523 from a total of 2,190 - just a smidgen under 1 in 4.

So, pedantically, it isn't true for the most current data, but yes, this true for last year and virtually every point in the past 34 years.


Cadogan makes another point at about the differences in the reduction of male and female victim homicide rates, a conclusion "most morons could draw after even a cursory look" - that there has been a 75% reduction in the rate of female victims and but only a 30% reduction in the rate of male victims.

Apparently, I am not like most morons, because I can't see how he has drawn that conclusion. Using the data to 2022, like he did (to steel-man his argument), the rate for female victims dropped from 0.95 per 100,000 in 1990 to 0.25 in 2022 - a 74% drop. Meanwhile, for male victims it dropped from 0.36 to 0.09 - a 75% drop.

1
  • Comments have been moved to chat; please do not continue the discussion here. Before posting a comment below this one, please review the purposes of comments. Comments that do not request clarification or suggest improvements usually belong as an answer, on Skeptics Meta, or in Skeptics Chat. Comments continuing discussion may be removed.
    – Oddthinking
    Commented May 22 at 7:07
16

I'm new to skeptics SE, but, as I earn my living by analysing data, I thought I'd give it a try. My analysis is based on the raw data linked by Oddthinking (+1).

The claim in the question:

One in four victims of intimate partner homicide in Australia are male

is true, as far as the data can tell:
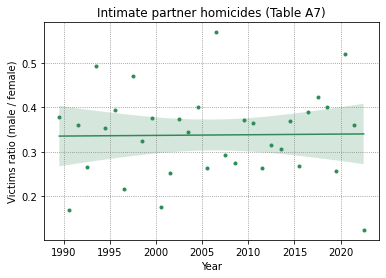
Victim ratios (male/female) per year

Per every female victim there are, on average, 0.337 male victims. Or, in terms of risk ratios, 25.2% of all victims are male. The ratio is highly stable over the years (p > 0.9).

This stability is in line with what Oddthinking found about another claim:

there has been a 75% reduction in the rate of female victims and but only a 30% reduction in the rate of male victims.

Both victim rates fall over time with almost the same speed, relative to the initial rate:
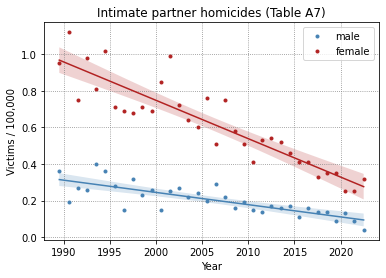
Victim rates per sex and year

Edit in response to comments:

As we are talking about rates and the numbers of victims can never be negative, linear model is not the most appropriate one. It is simple and sufficient enough to answer the question (plus, I can draw the nice confidence band), but, strictly speaking, a Poisson model is better (it is a generalised linear model, where we assume the exponent to behave linearly with time).

For male victims we obtain:

                       Results: Poisson
==============================================================
Model:              Poisson          Method:           MLE    
Dependent Variable: rMale            Pseudo R-squared: 0.024  
Date:               2024-05-22 09:34 AIC:              33.6676
No. Observations:   34               BIC:              36.7203
Df Model:           1                Log-Likelihood:   -14.834
Df Residuals:       32               LL-Null:          -15.195
Converged:          1.0000           LLR p-value:      0.39544
No. Iterations:     5.0000           Scale:            1.0000 
---------------------------------------------------------------
            Coef.   Std.Err.     z     P>|z|    [0.025   0.975]
---------------------------------------------------------------
Intercept  -1.4390    0.3958  -3.6358  0.0003  -2.2148  -0.6633
year       -0.0334    0.0399  -0.8365  0.4029  -0.1115   0.0448
==============================================================

and for female:

                       Results: Poisson
==============================================================
Model:              Poisson          Method:           MLE    
Dependent Variable: rFemale          Pseudo R-squared: 0.041  
Date:               2024-05-22 09:34 AIC:              58.0778
No. Observations:   34               BIC:              61.1305
Df Model:           1                Log-Likelihood:   -27.039
Df Residuals:       32               LL-Null:          -28.206
Converged:          1.0000           LLR p-value:      0.12653
No. Iterations:     5.0000           Scale:            1.0000 
---------------------------------------------------------------
             Coef.   Std.Err.     z     P>|z|    [0.025  0.975]
---------------------------------------------------------------
Intercept   -0.3245    0.2265  -1.4331  0.1518  -0.7684  0.1193
year        -0.0344    0.0229  -1.5025  0.1330  -0.0794  0.0105
==============================================================

As you can see, both rates decrease with almost the same yearly rate, exp(-0.334) = 0.967 for males and exp(-0.344) = 0.966 for females. exp(-0.3245) = 0.72 is the modelled rate for women in my reference year, the year 2000, and exp(-1.4390) = 0.24 for men:
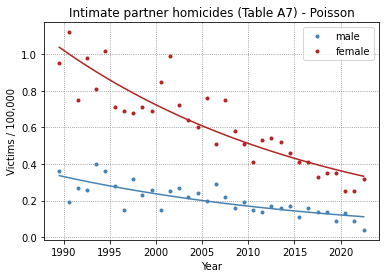
Victim rates per sex and year - Poisson model

The ratio of the two rates is 3.05, i.e. for every three female victims there is almost exactly one male victim. That answers the original question. Anyone having questions regarding statistical methodology, please post them on CrossValidated.

8
  • "Both victim rates fall over time with almost the same speed, relative to the initial rate:" That's not what the chart shows. The slope of the red line is visibly much steeper than the blue one. The labels aren't precise enough to clearly validate the claimed reduction rates of 75% vs 30% — to my eye it looks more like 75% vs 50%, but I'm not particularly confident in that — but it's clear that there's a significant difference. Commented May 21 at 15:25
  • 8
    @MasonWheeler Similar slopes would put male deaths in negative territory; this is obviously not possible. From about 0.3 to 0.1 and from about 1.0 to 0.3 is roughly the same percentage of reduction (a 2/3 reduction); the chart does indeed show comparable rates in victimization decrease for both genders.
    – ceejayoz
    Commented May 21 at 15:45
  • @ceejayoz, "Similar slopes would put male deaths in negative territory; this is obviously not possible." -- agreed, but that does not make the claim that the rates are falling at the same speed correct. The observation should be that the proportion of female victims to male victims remains about the same, which this answer already says. Or that the relative decrease is about the same for both groups, which follows from the previous. Commented May 21 at 20:01
  • 6
    @ceejayoz "Similar slopes would put male deaths in negative territory" Broadly speaking, that's a sign that the axis should be a log scale because you have a cumulative (compounding) reduction.
    – user71659
    Commented May 21 at 20:31
  • "Per every female victim there are" That's a non-standard use of "per". Commented May 22 at 3:17

You must log in to answer this question.

Not the answer you're looking for? Browse other questions tagged .