The source provides no methodology.
tl;dr The claim that "if age distribution were equal" is not complete. The original source adjusts COVID mortality by age and an ill-defined "metabolic health". They provide no methodology for either. Without knowing the details, they could have done any amount of monkeying with the numbers.
The results are meaningless.
The Britannica Claim
Florida's death rate from COVID-19 (75,000 deaths) ended up being within the national average and Florida's economy fared better than many other U.S. states.
This is from a Britannica article about Ron DeSantis and provides no citations how they concluded Florida is within the national average.
The Bloomberg Claim
in May 2022, a Bloomberg News op-ed claimed that, when adjusting state death tolls based on what they would be if age distribution were equal between the states, Florida's COVID-19 death toll would be less than the national average
This is from an op-ed by Justin Fox. He is a Bloomberg Opinion columnist covering business, not health. The same op-ed was posted in the Washington Post with no paywall.
Hiding inequality in averages
The relevant claim appears to be this:
Adjust state Covid mortality statistics to what they would be if all the states’ populations had roughly the same age distribution as the nation — as conservative activist and policy analyst Phil Kerpen has been doing for much of the pandemic — and Florida’s rate drops to 275 per 100,000, well below the national rate of 302, while California’s rises to 267.
Phil Kerpen is a founder of the Committee To Unleash Prosperity. More on them in a moment.
We must address whether ignoring a state's demographics is a relevant statistic. It smacks of the "sacrifice the elderly" modest proposals of the early pandemic.
Population demographics are not a hypothetical. Those are real people, really getting sick, and really dying. Instead of arguing that Florida would have done better with average demographics, one can argue Florida failed to adapt their policies to their population.
It's very tempting to boil everything down into a single number for the "average person", but there is no such thing as an average person. Populations are messy. For example, (50, 50, 50, 50) and (-100, 100, 200, 0) are very different sets of numbers, but they average (mean) out the same. Abusing population averages is a way to hide inequalities.
I would argue that if we really want to compare states without being biased by their age distributions, we shouldn't be mashing all ages together into one statistic. We should be looking at COVID mortality rates by age. This removes the age distribution bias without artificially smoothing out bumps. We should compare people apples-to-apples, not applesauce-to-applesauce.
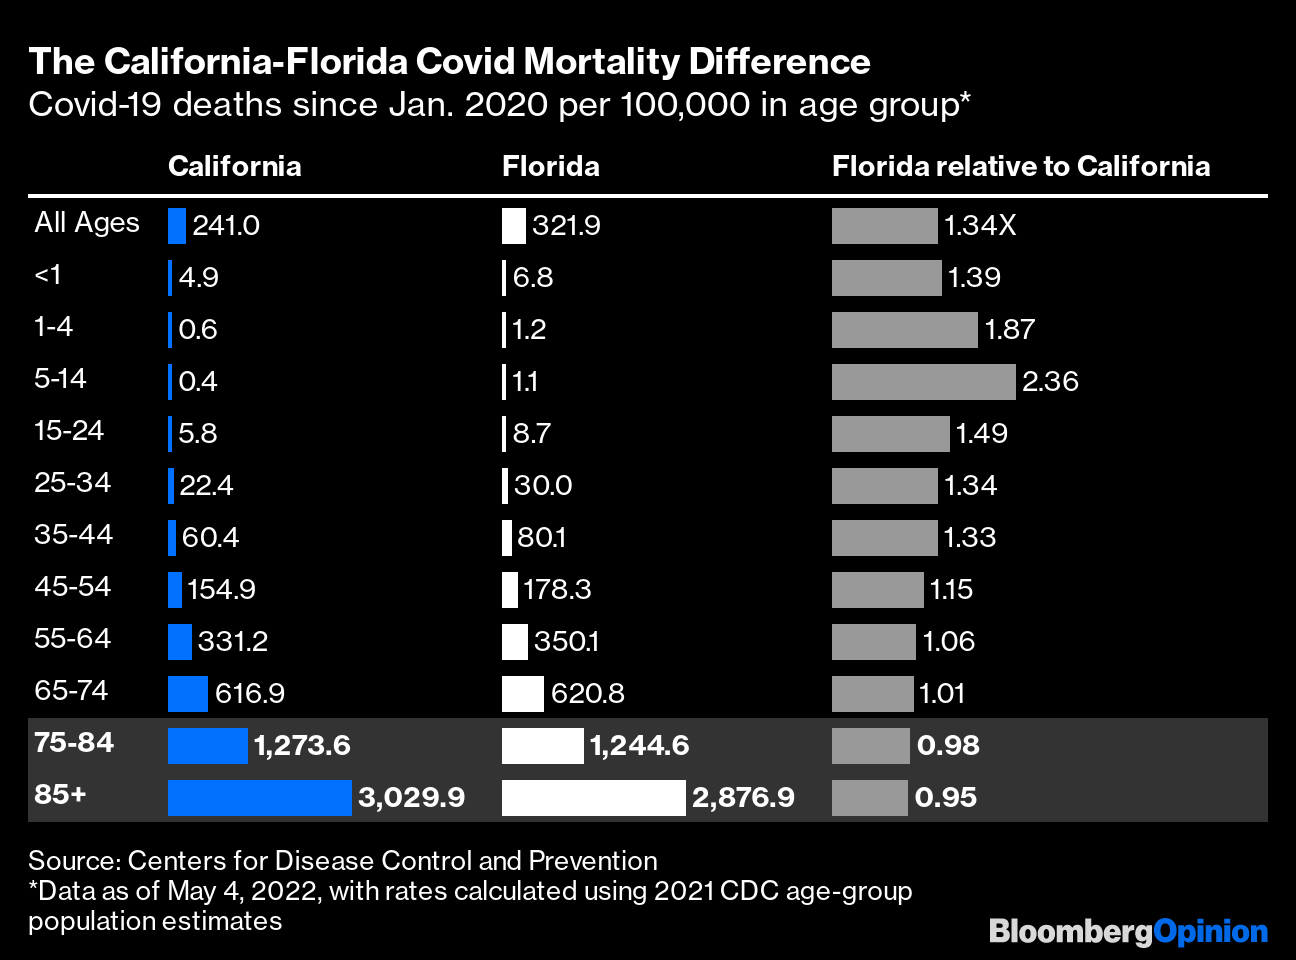
That's just what this chart already does...

...we can see that, relative to California, Florida did as good or slightly better with their 75+ population. However, they did far worse with their younger populations. That is more meaningful information than one number for all ages.
One could argue that doing worse in younger populations is less relevant because their death rates are orders of magnitude lower than the 75+ rates, but this all teeters on the verge of devaluing lives. Devaluing the elderly by ignoring the demographic differences and devaluing the young by ignoring their higher death rates in Florida.
A Final Report Card on the States’ Response to COVID-19
This claim appears to be sourced from A Final Report Card on the States’ Response to COVID-19 by Phil Kerpen, Stephen Moore and Casey Mulligan of the Committee To Unleash Prosperity. The numbers don't exactly agree, maybe they were using an earlier version, but they are very close.
The Committee To Unleash Prosperity is an organization to promote supply side economics. They are anti-regulation. Its founders are all economists, not public health professionals. All the authors of the paper are economists, not public health professionals.
Critically, there's little discussion of their methodology; no formulas are provided. However, while the article only mentions age, the report also includes "metabolic health"...
We adjust COVID mortality (through March 5, 2022) for age and “metabolic health,” by which we mean the pre-pandemic prevalence of obesity and diabetes – as these are highly correlated with higher death
rates from the virus.
There is no methodology about how they calculated or applied "metabolic health". How did they determine the prevalence? How did it affect the COVID mortality rate? Why only obesity and diabetes? Why not respiratory problems? Auto-immune diseases? Without that information, we can't check their math; their adjusted COVID mortality rates are meaningless. They could have used it as a fudge factor, tweaking the method until they got the result they wanted.
With all this in mind, and the lack of methodology, the source cannot be used.


