When talking about "safety", you could mean one of many metrics. Some common ones include:
- Deaths per day per intersection.
- Accidents per day per intersection.
- Deaths per car entering the intersection.
- Accidents per car entering the intersection.
- Deaths per person-mile traveled.
- Accidents per person-mile traveled.
- Deaths per person-hour traveling.
- Accidents per person-hour traveling.
- Deaths per person-trip.
- Accidents per person-trip.
- Person-lifetimes per person-mile traveled.
- Person-lifetimes per person-trip.
Now consider three alternatives:
Intersection A lets through 2 vehicles per unit of time, on average. Each vehicle takes ten units of time and distance for its trip. One in a million vehicles crash; 1 in ten vehicle crashes result in a fatality.
Intersection B lets through 1 vehicle per unit of time on average. Each vehicle takes a hundred units of time and four units of distance for its trip. Two in a million vehicles crash; one in forty vehicle crashes result in a fatality.
Intersection C... no-one uses intersection C, because a vehicle would require a literal lifetime to go through it, and so people have changed their routes, instead taking a thousand-unit of time and distance to avoid it.
Now. Which of these is safest?
Intersection C wins for deaths and accidents per day per intersection, fairly trivially (no-one ever uses it). Intersection C loses for person-lifetimes per person-trip or person-mile, again fairly trivially.
Intersection A wins on accidents per car entering the intersection. Intersection B wins on deaths per car entering the intersection.
Intersection A wins on deaths per person-mile traveled. Intersection B wins on deaths per person-hours traveled.
Given all of the above, it would be misleading to say that intersection B was safer than intersection A, even if you provided (correct) backing statistics showing that intersection B wins on deaths per car entering the intersection. It would also be misleading to say that intersection B was less safe than intersection A, even if you provided (correct) backing statistics showing that intersection A wins on deaths per person-mile traveled.
So. Coming back to your question:
Are roundabouts actually safer than traditional intersections, and I'm just seeing issues caused by the adoption of the new and unfamiliar? Or are these statistics false or misleading?
Roundabouts are safer by some metrics than traditional intersections; these statistics are arguably misleading for the claim that roundabouts are safer in general.
Roundabouts tend to be superior w.r.t. deaths per day and deaths per vehicle, and you'll see many statistics that show this (e.g. your link, or https://rosap.ntl.bts.gov/view/dot/35084 , etc.)
Table one of https://dr.lib.iastate.edu/server/api/core/bitstreams/6d1e271e-1a94-4b98-afbb-95f62e805832/content shows 5.6 fatal accidents per billion vehicles entering the intersection for high-speed signals, and 1.9 fatal accidents per billion vehicles entering the intersection for high-speed roundabouts. This is a difference of 3.7 fatal accidents per billion vehicles in favor of roundabouts.
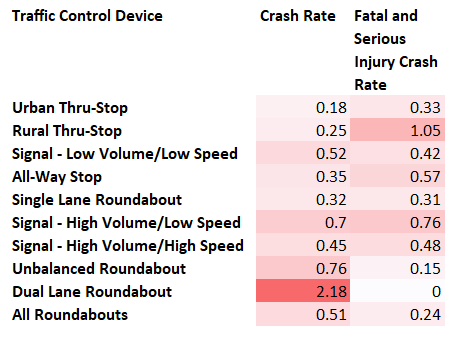
Roundabout accident rates are often higher per vehicle, especially in unbalanced and multilane roundabouts. (e.g. the Minnesota paper with "Many of the [unbalanced roundabout] sites have seen an increase in the frequency of crashes, and the overall total crash rates. However, unbalanced roundabouts are achieving a noticeable reduction in fatal, serious injury, and other injury crashes.").
It is difficult to directly find comparative statistics on the other metrics for roundabouts versus signaled intersections. You generally have to combine multiple statistics and hope you haven't introduced bias in the process.
There are situations where roundabouts are slower than alternatives. (There are also situations where a roundabout is faster than alternatives.) (To disambiguate: 'slower' in the sense of 'taking longer for a specific vehicle to get through the intersection'.) Consider the intersection of a high-traffic high-speed road and a low-traffic road, for instance. A controlled intersection can be set up with traffic sensors, where the light normally stays green for the high-traffic road, only changing when a car actually shows up on the low-traffic road. This results in most cars not having to slow down, and very little average delay. Meanwhile, a roundabout will always require cars to slow down and turn, regardless of how much traffic is on the sidestreet. This shows up as increased average intersection control delays.
Compare table 3 of https://onlinepubs.trb.org/Onlinepubs/circulars/ec083/42_Kaubpaper.pdf (the first paper I could find that included estimated average delay for both a signal and corresponding roundabout, if you're wondering). In this case, moving from a signal to a roundabout increases estimated average delay from 11.9/15.0 seconds to 20.6/33.4 seconds, or an increase of 8.7/18.4 seconds in AM/PM, respectively.
Assume as a ballpark guess that average vehicle occupancy is roughly the same as average fatalities in a fatal crash, and so 3.7 fatal accidents/billion translates to ~3.7 fatalities per billion vehicles entering the intersection. (I'd love to hear about better numbers here.) Meanwhile, US life expectancy in 2019 was 78.8 years, or ~700 thousand hours. 3.7 person-lifetimes per billion vehicles entering the intersection translates to about 9.2 seconds.
You'll note that 8.7 < 9.2, but 18.4 > 9.2. So in this case, the roundabout won in person-lifetimes per transit in the morning, but lost in the afternoon.
(There are several issues with this analysis. The average age of people driving is greater than zero. On the other hand, time spent in transit is arguably not completely wasted. On the other other hand, average vehicle occupancy is more than one. On the other other other hand, average fatalities per fatal crash is also more than one.)


