3

The Liberal Party of Australia posted a claim on Facebook that Australia's emissions have fallen to the lowest level since 1990. Is this accurate?

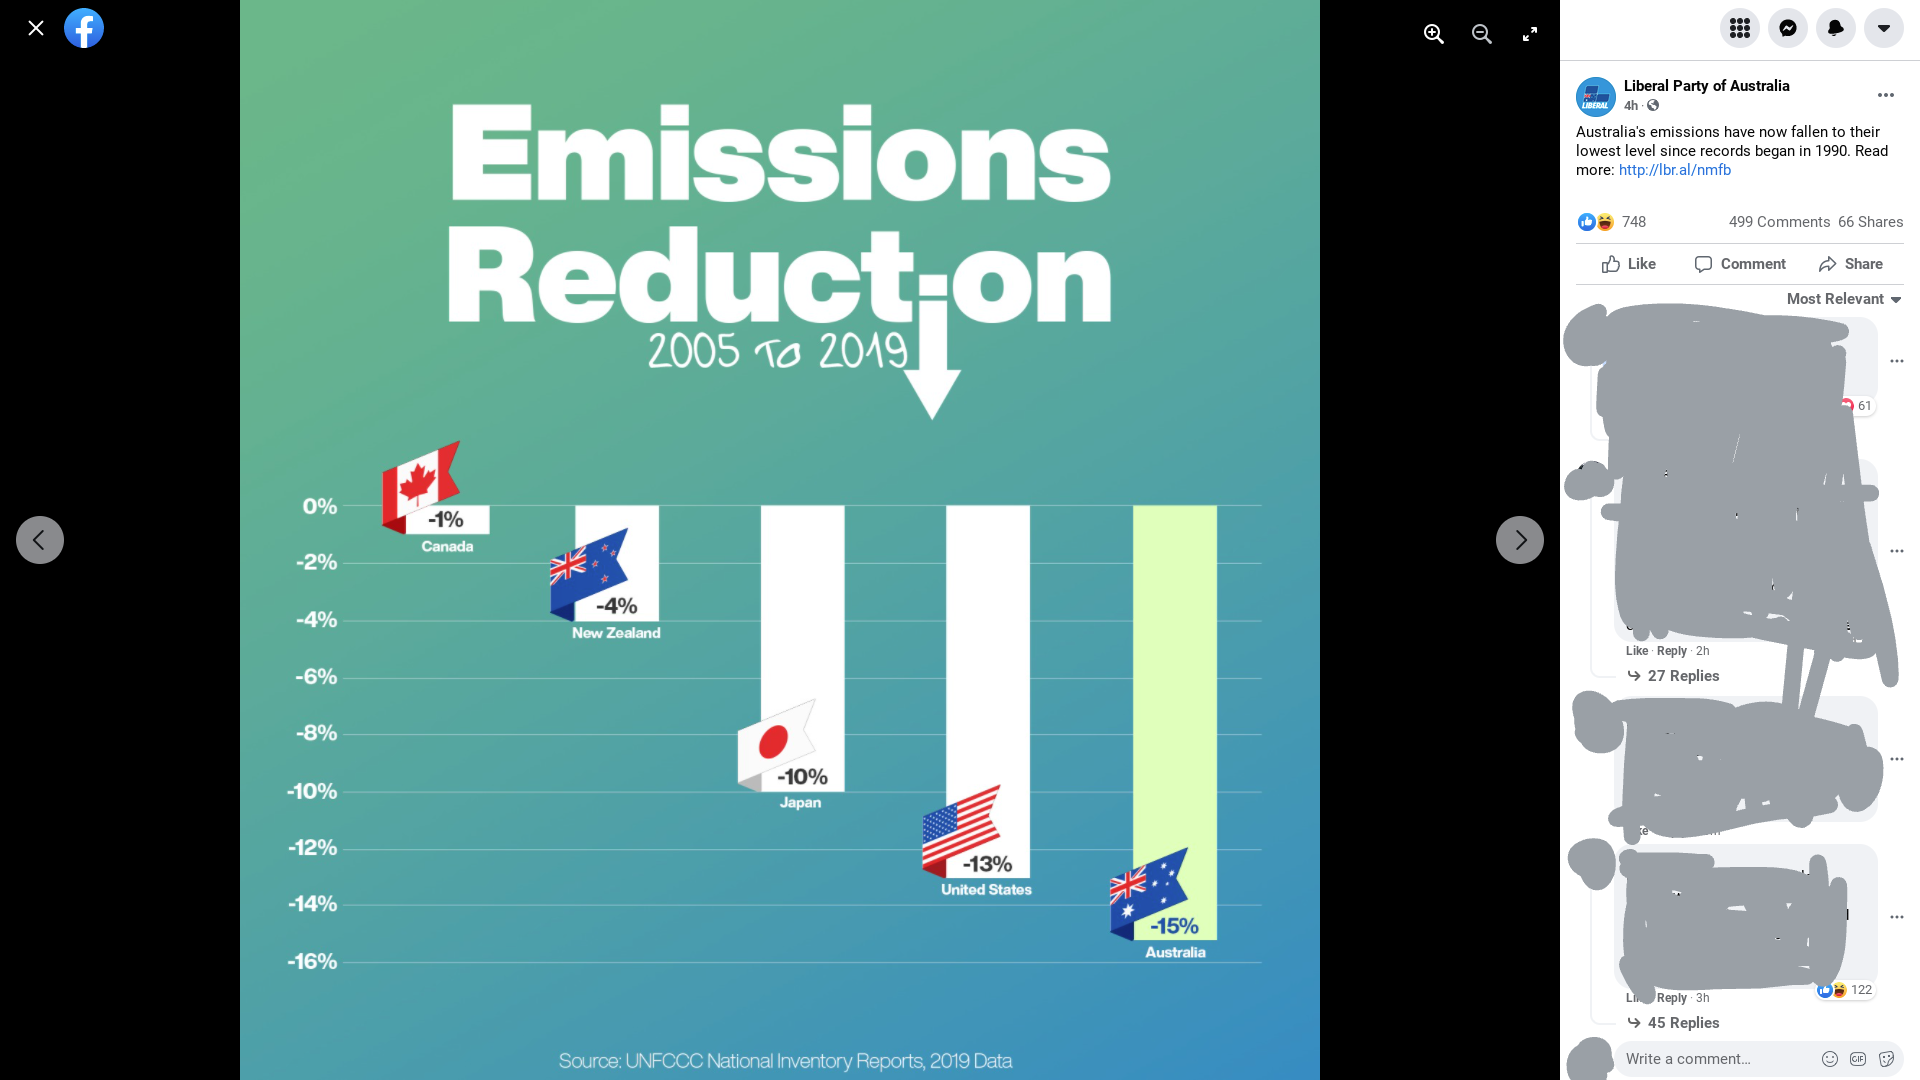
Below is a screenshot of the Facebook post, and extracted text

Australia's emissions have now fallen to their lowest level since records began in 1990. Read more: http://lbr.al/nmfb

Facebook post highlighting emissions reductions 2005-2019.  Canada: -1%, New Zealand: -4%, Japan: -10%, US: -13%, Australia: -15%

3
  • 1
    Worth pointing out that the illustration is somewhat separate from the claim in the text.
    – pipe
    Commented Jun 7, 2021 at 13:02
  • 6
    In its current form, this question feels rather lazy: the Facebook post you quote prominently links to a much more detailed statement, and that in turn links to the official government report being discussed, with a nice big graph showing the values since 1990 (the previous low is actually in 1995), and copious data free to download. If you have reason to be skeptical of that government report, it would be much better to quote a claim from the report itself.
    – IMSoP
    Commented Jun 7, 2021 at 13:50
  • And yet the atmospheric carbon dioxide keeps increasing at an increasing rate . Commented Jun 7, 2021 at 15:07

1 Answer 1

5

tl;dr: Australia's GHG emissions probably declined significantly in 2020 due to COVID-19, but to know if they declined to their lowest since 1990, we'll need to wait until other analysis is available.

How does Australia's counting of Australia's emissions compare to how others count?

Without digging too deep into how the Australian Department of Industry, Science, Energy, and Resources counts emissions, we can see that it diverges significantly from how other agencies are counting. (Note that all three sources below include land use change in their accounting).

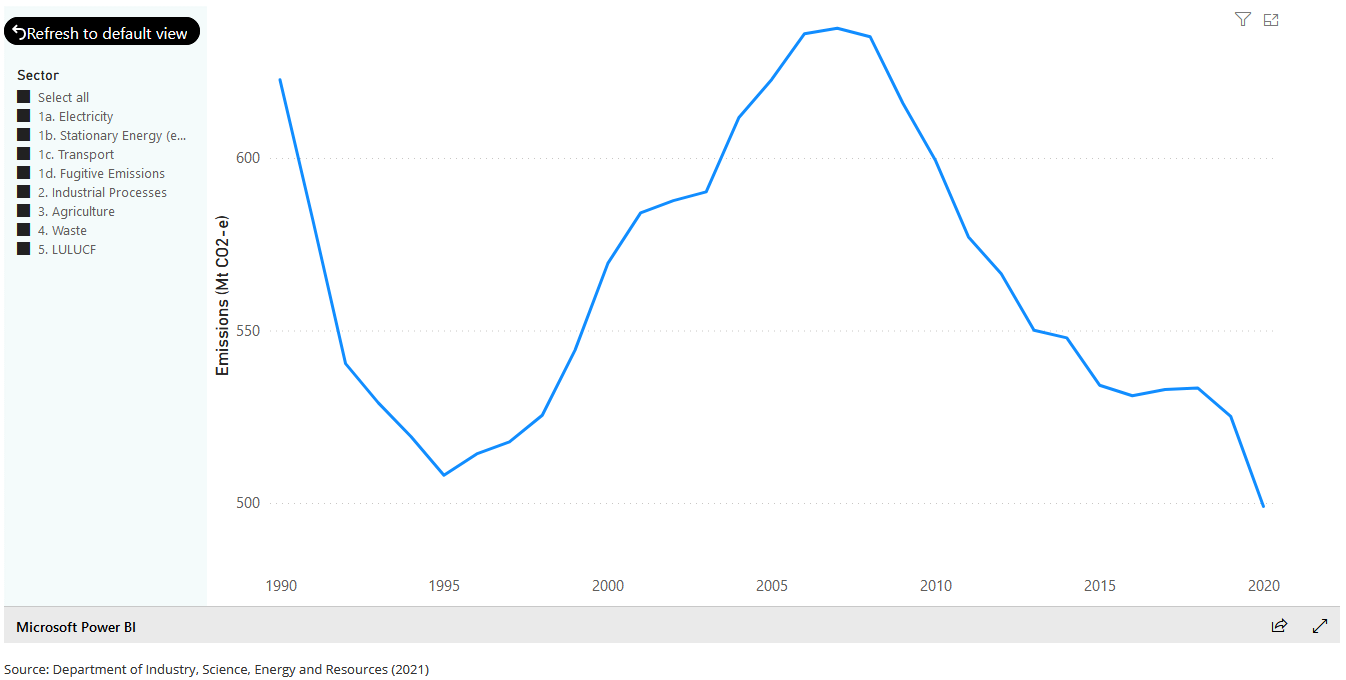
  1. From the Australian government:

Australian government GHG tracking

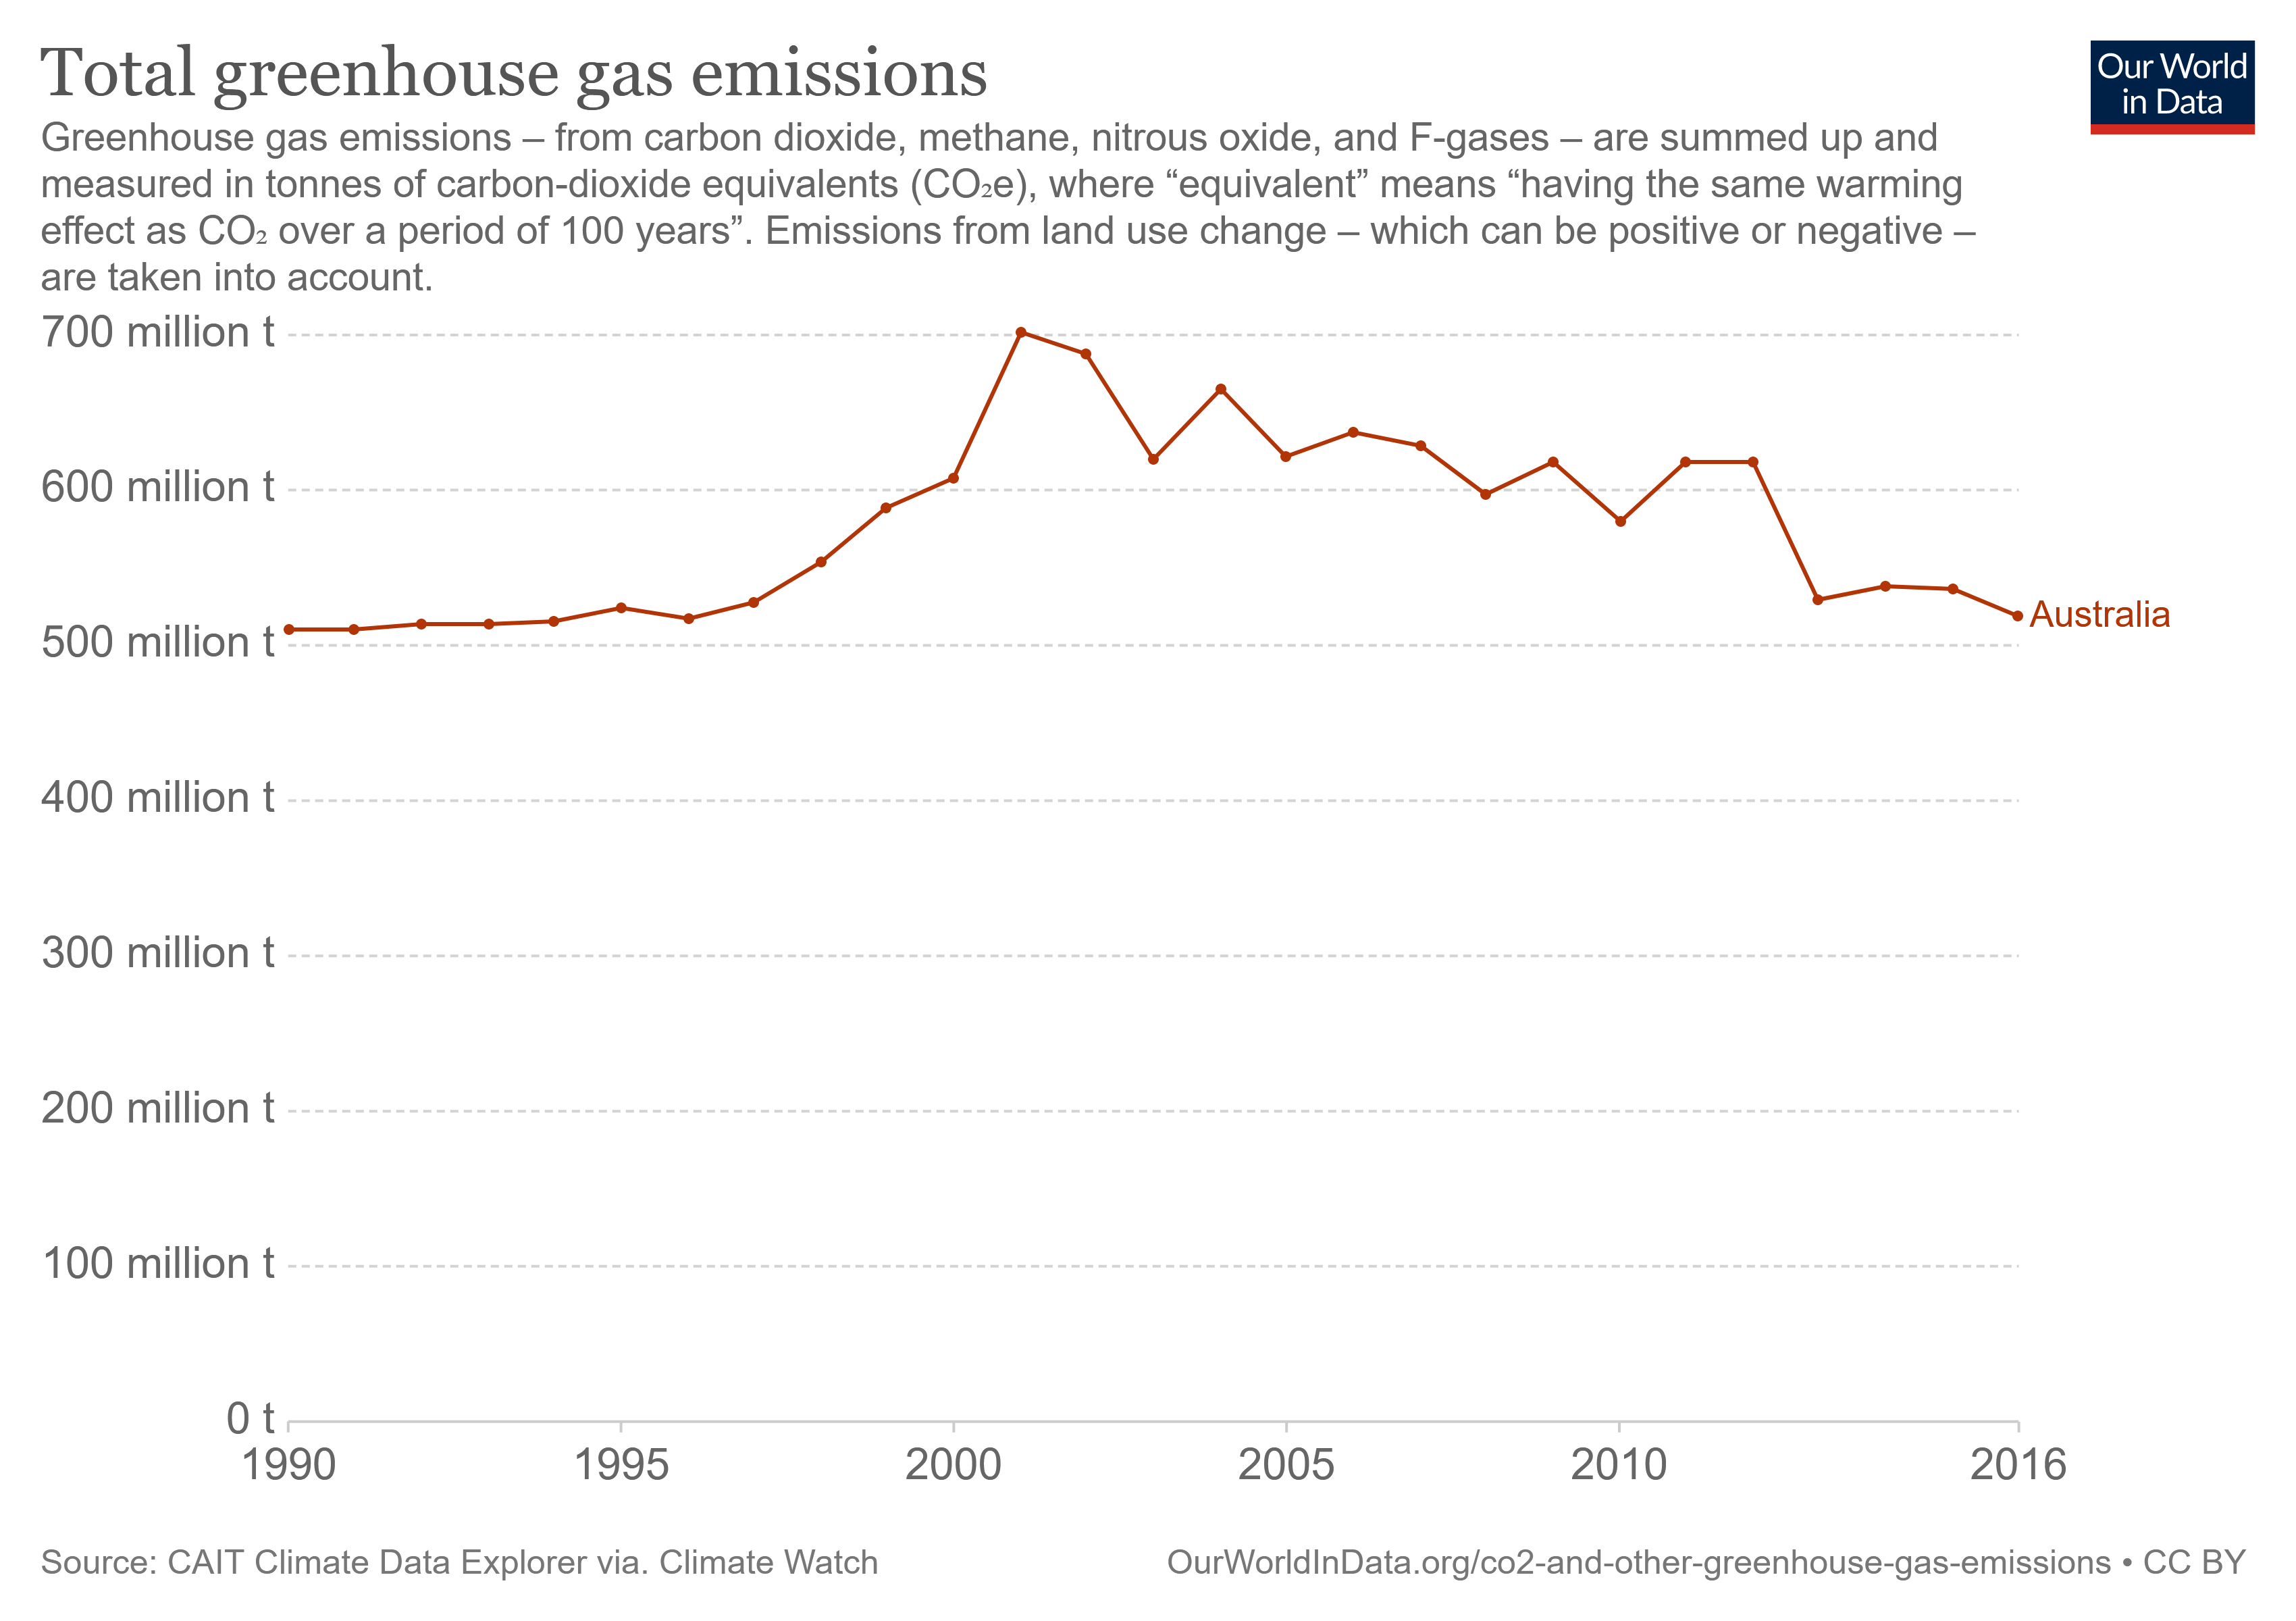
  1. From Climate Watch, via Our World in Data:
Climate Watch GHG tracking, Australia

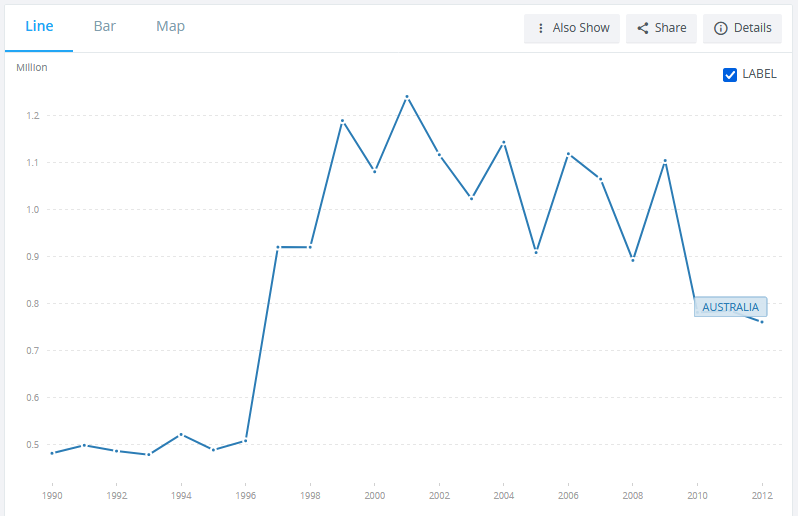
  1. From the EU's emissions tracking agency, via The World Bank:
EU GHG tracking, Australia

Notably, Climate Watch and the EU don't show 1990 levels being nearly as high as Australia's own accounting.

Does a record-low 2020 match the trends?

However, the real claim isn't about 1990 specifically -- just that emissions are lower than they've been since 1990. On this count, all three sources agree that emissions are trending downward, and probably within striking range.

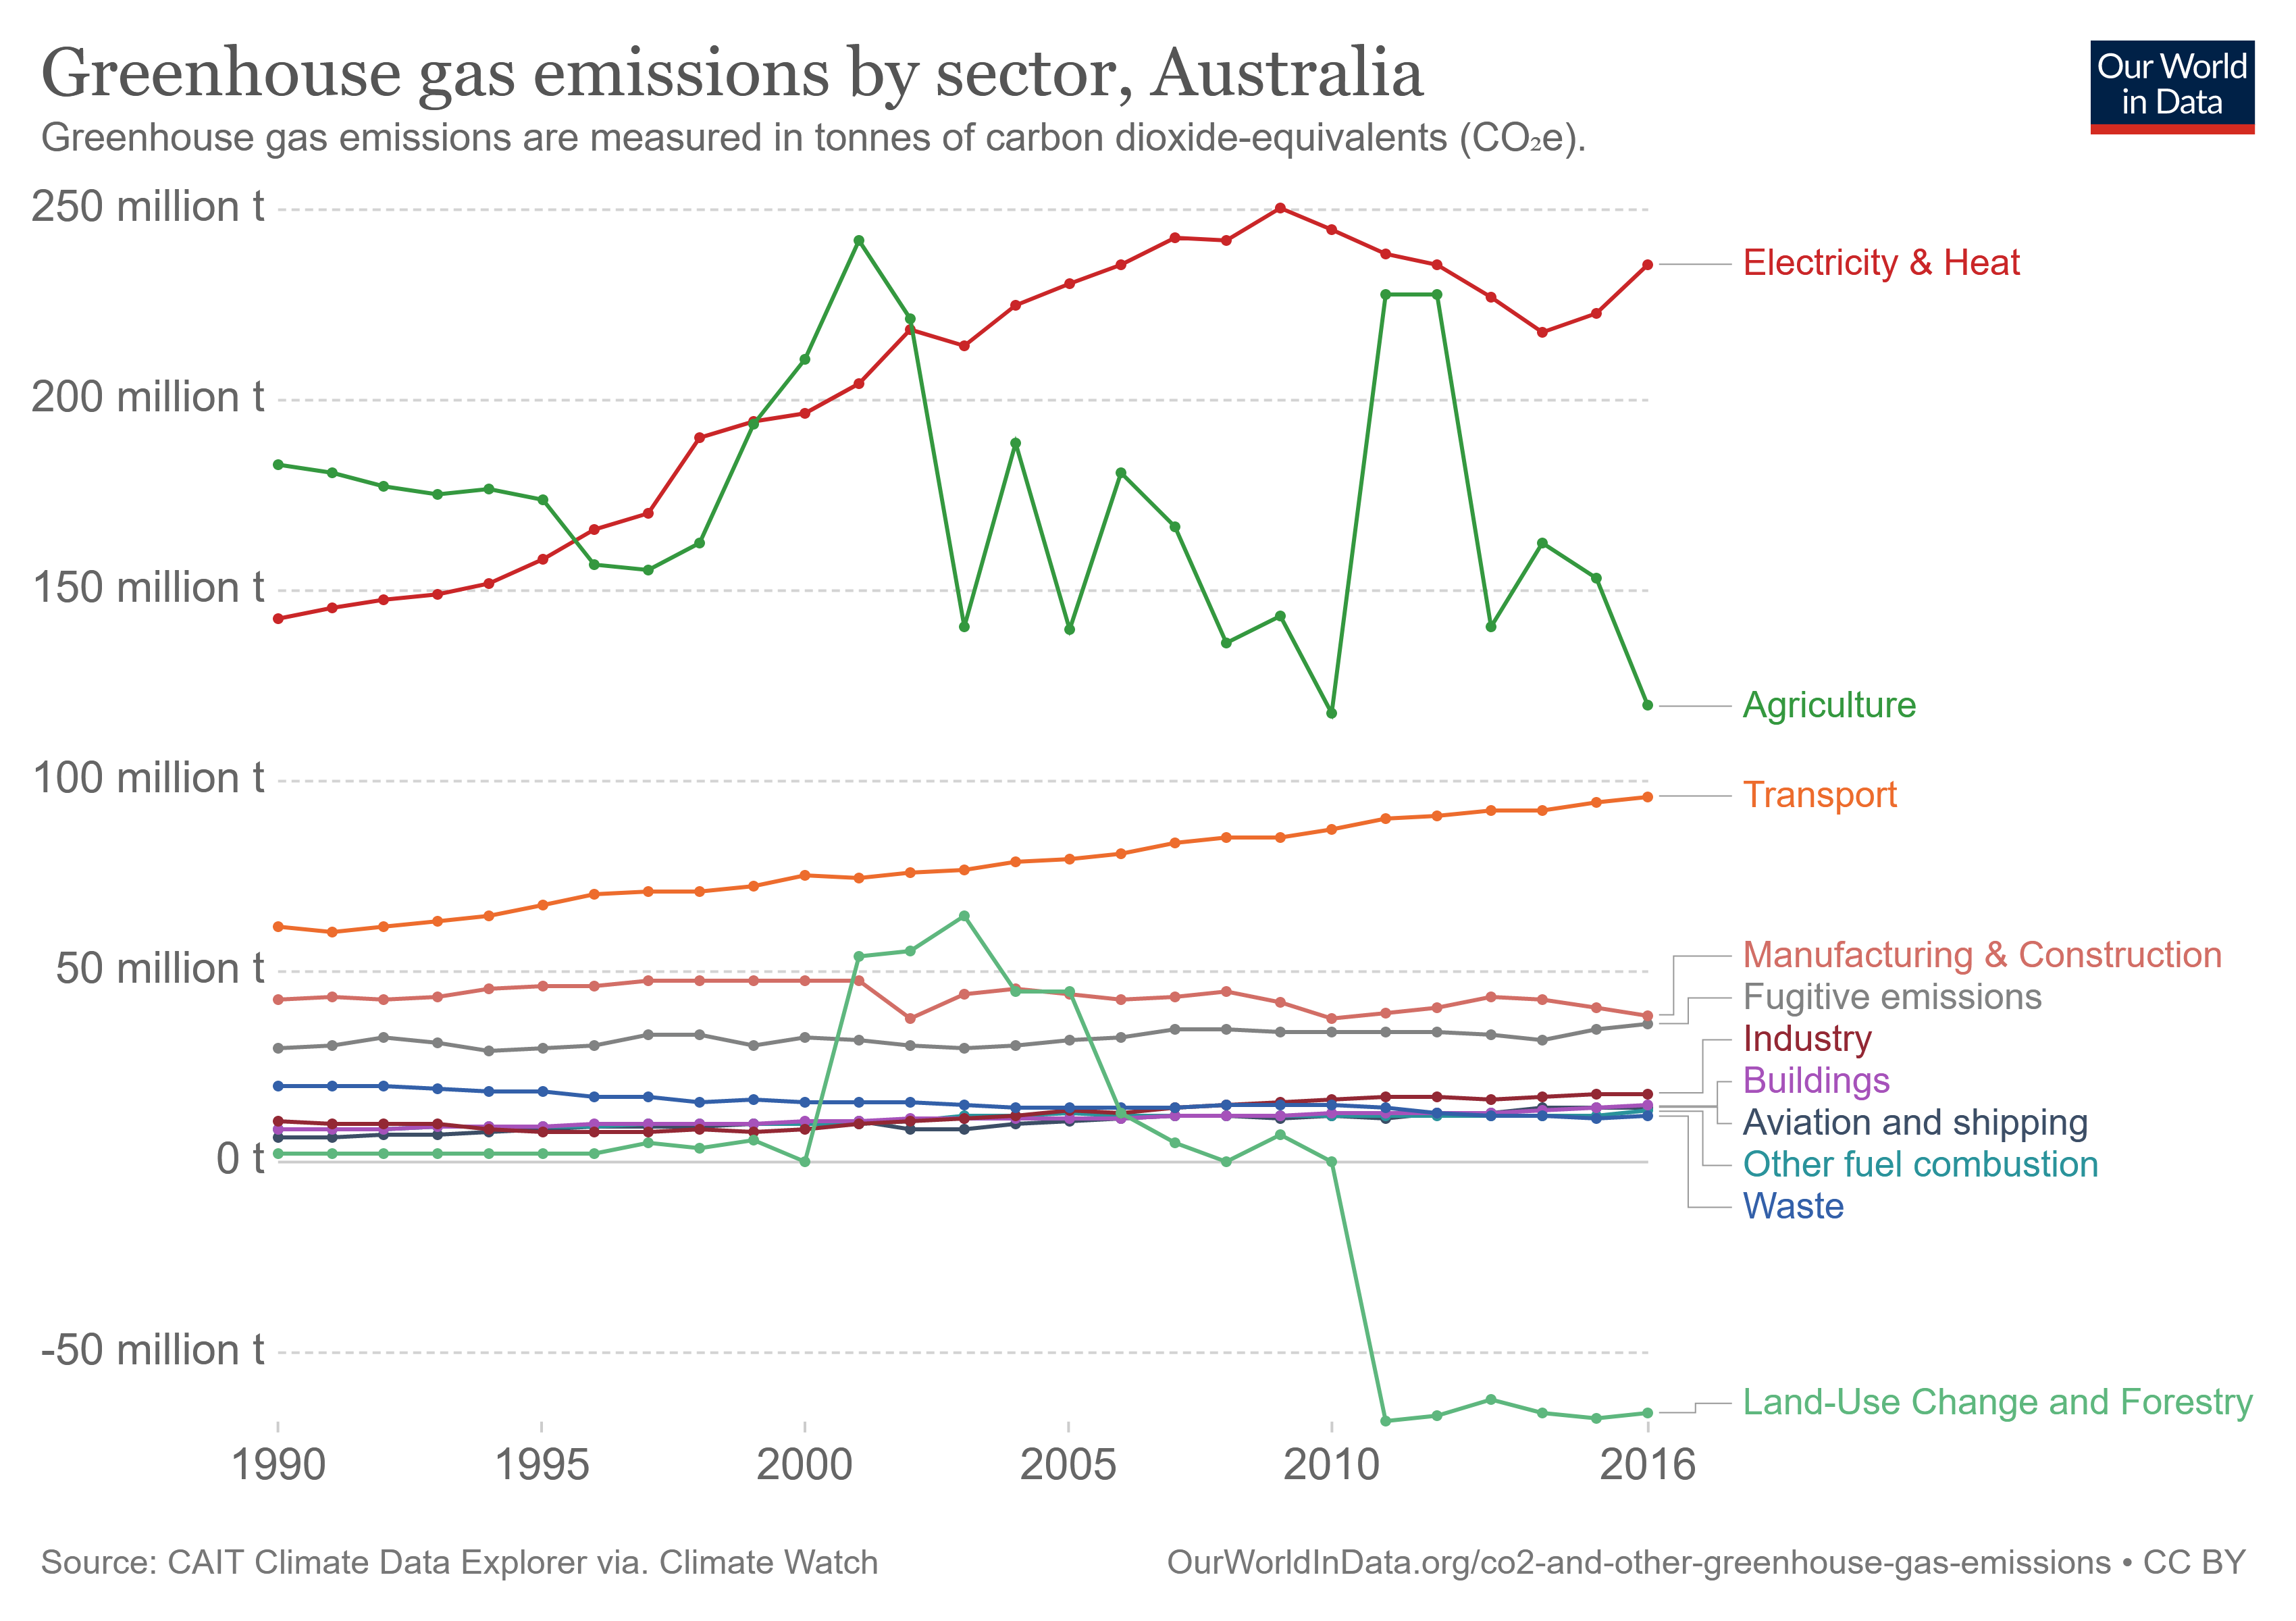
This is largely due to two factors which we wouldn't expect to change drastically over the course of a year:

  1. A shift in primary energy consumption from coal to natural gas, which results in half the emissions per kWh produced than coal.
  2. Land use, land use change, and forestry.

Both trends are illustrated here:
Greenhouse gas emissions by sector, Australia

Could COVID-19 have caused emissions to drop even faster than the trends?

A recent report from the Global Carbon Project tracked the impact of COVID-19 on emissions by country: "Temporary reduction in daily global CO2 emissions during the COVID-19 forced confinement". Here's the sectoral data for Australia:
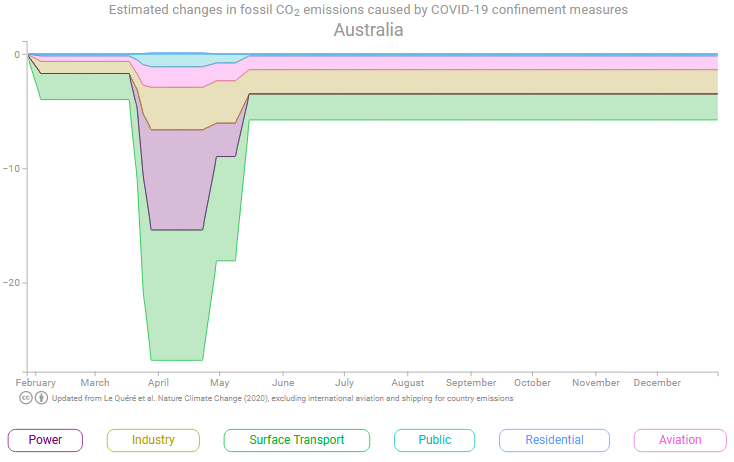
Estimated changes in fossil CO2 emissions in Australia caused by COVID-19 confinement measures

Transportation and electric power, two of the largest sources of emissions overall, also showed the greatest reduction due to COVID-19, so it's entirely possible that, when combined with declining trends overall, Australia's 2020 emissions did drop to their lowest level since 1990.

1
  • 1
    Might be worth mentioning that the Labor party was in govt from 2007 to 2013, and in 2011 they brought in a carbon tax (it was proposed 2010). The incoming Liberal government in 2013 repealed it. The FB post carries an implication that the Liberals have reduced CO2 emissions, but it looks a lot like emissions stopped reducing when they came in and the reductions can be attributed to Labor. Commented Jun 9, 2021 at 3:07

You must log in to answer this question.

Not the answer you're looking for? Browse other questions tagged .