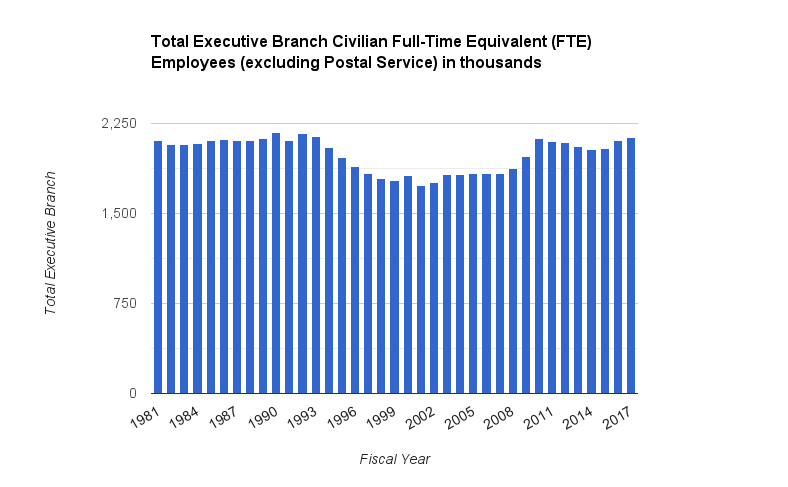
As DavePhD pointed out, the executive memorandum only applied to the executive branch. The Office of Management and Budget reports historical data since 1981 for "Total Executive Branch Civilian Full-Time Equivalent (FTE) Employees (excluding Postal Service)" in this file. I included the data at the bottom of this answer. For convenience, here is a plot of all values since 1981, made by me:

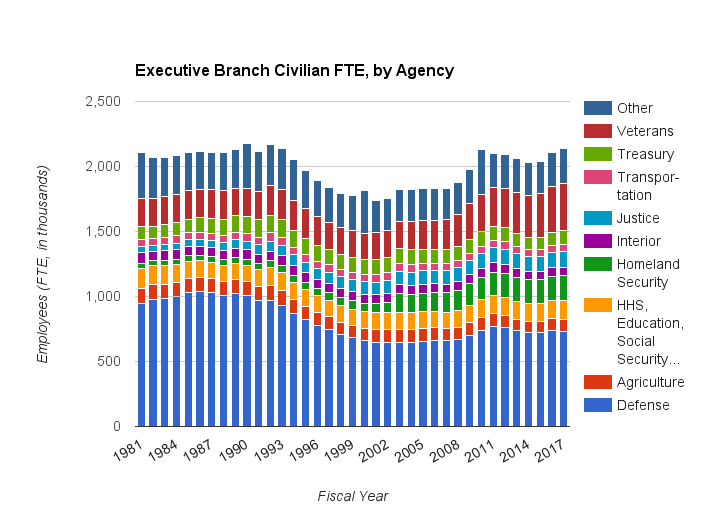
Also from the same data, we find that the agency that has grown the most (in %) over the last eight years is the Department of Veterans Affairs. The agencies that have grown in the last eight years are: Department of Defense (added 30k civilian employees, or 4% of its current number), HHS, Education, Social Security (added 15k, 10% of current), Homeland Security (18k, 10% of current), Justice (11k, 9% of current), Veterans (95k, 26% of current), and Other (2k, 1% of current). Some departments have become smaller over the last eight years: Agriculture (-3k, -3% of current), Interior (-2k, -3% of current), Treasury (-6k, -6% of current). Transportation has not changed.
In graphical form:

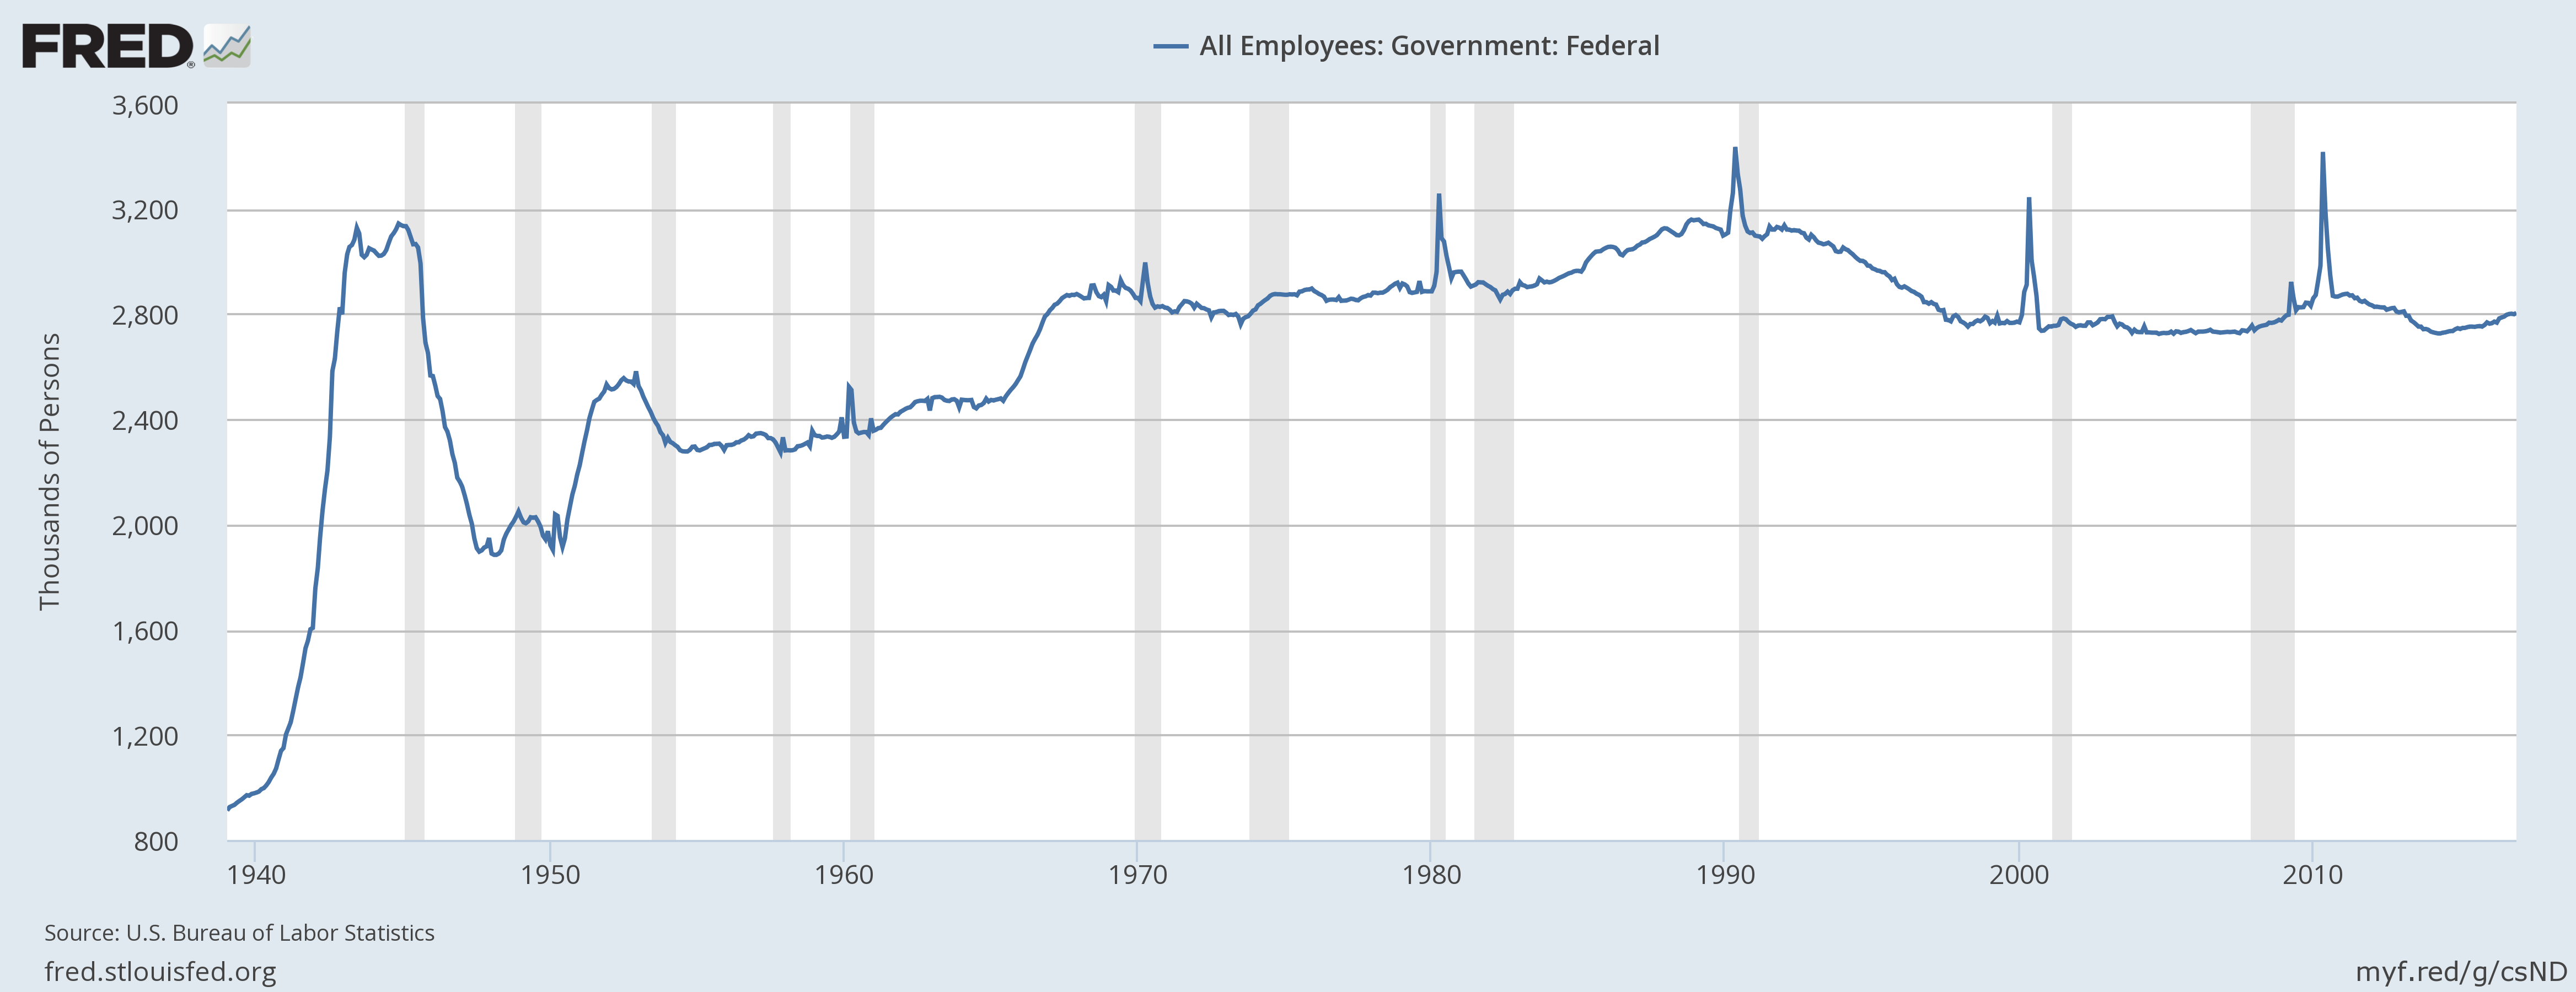
Since Sean Spicer did not specifically say he was referring to the executive branch when he claimed "dramatic expansion of the federal workforce", we might also consider total federal workforce. Here is "All Employees: Government: Federal" from the Bureau of Labor Statistic's Current Employment Statistics via FRED, in Thousands of Persons, Seasonally Adjusted (note: vertical axis begins at 800, horizontal axis begins around 1940):

Note that the federal government "experiences a spike in employment every 10 years for the collection of the decennial census" (as per BLS).
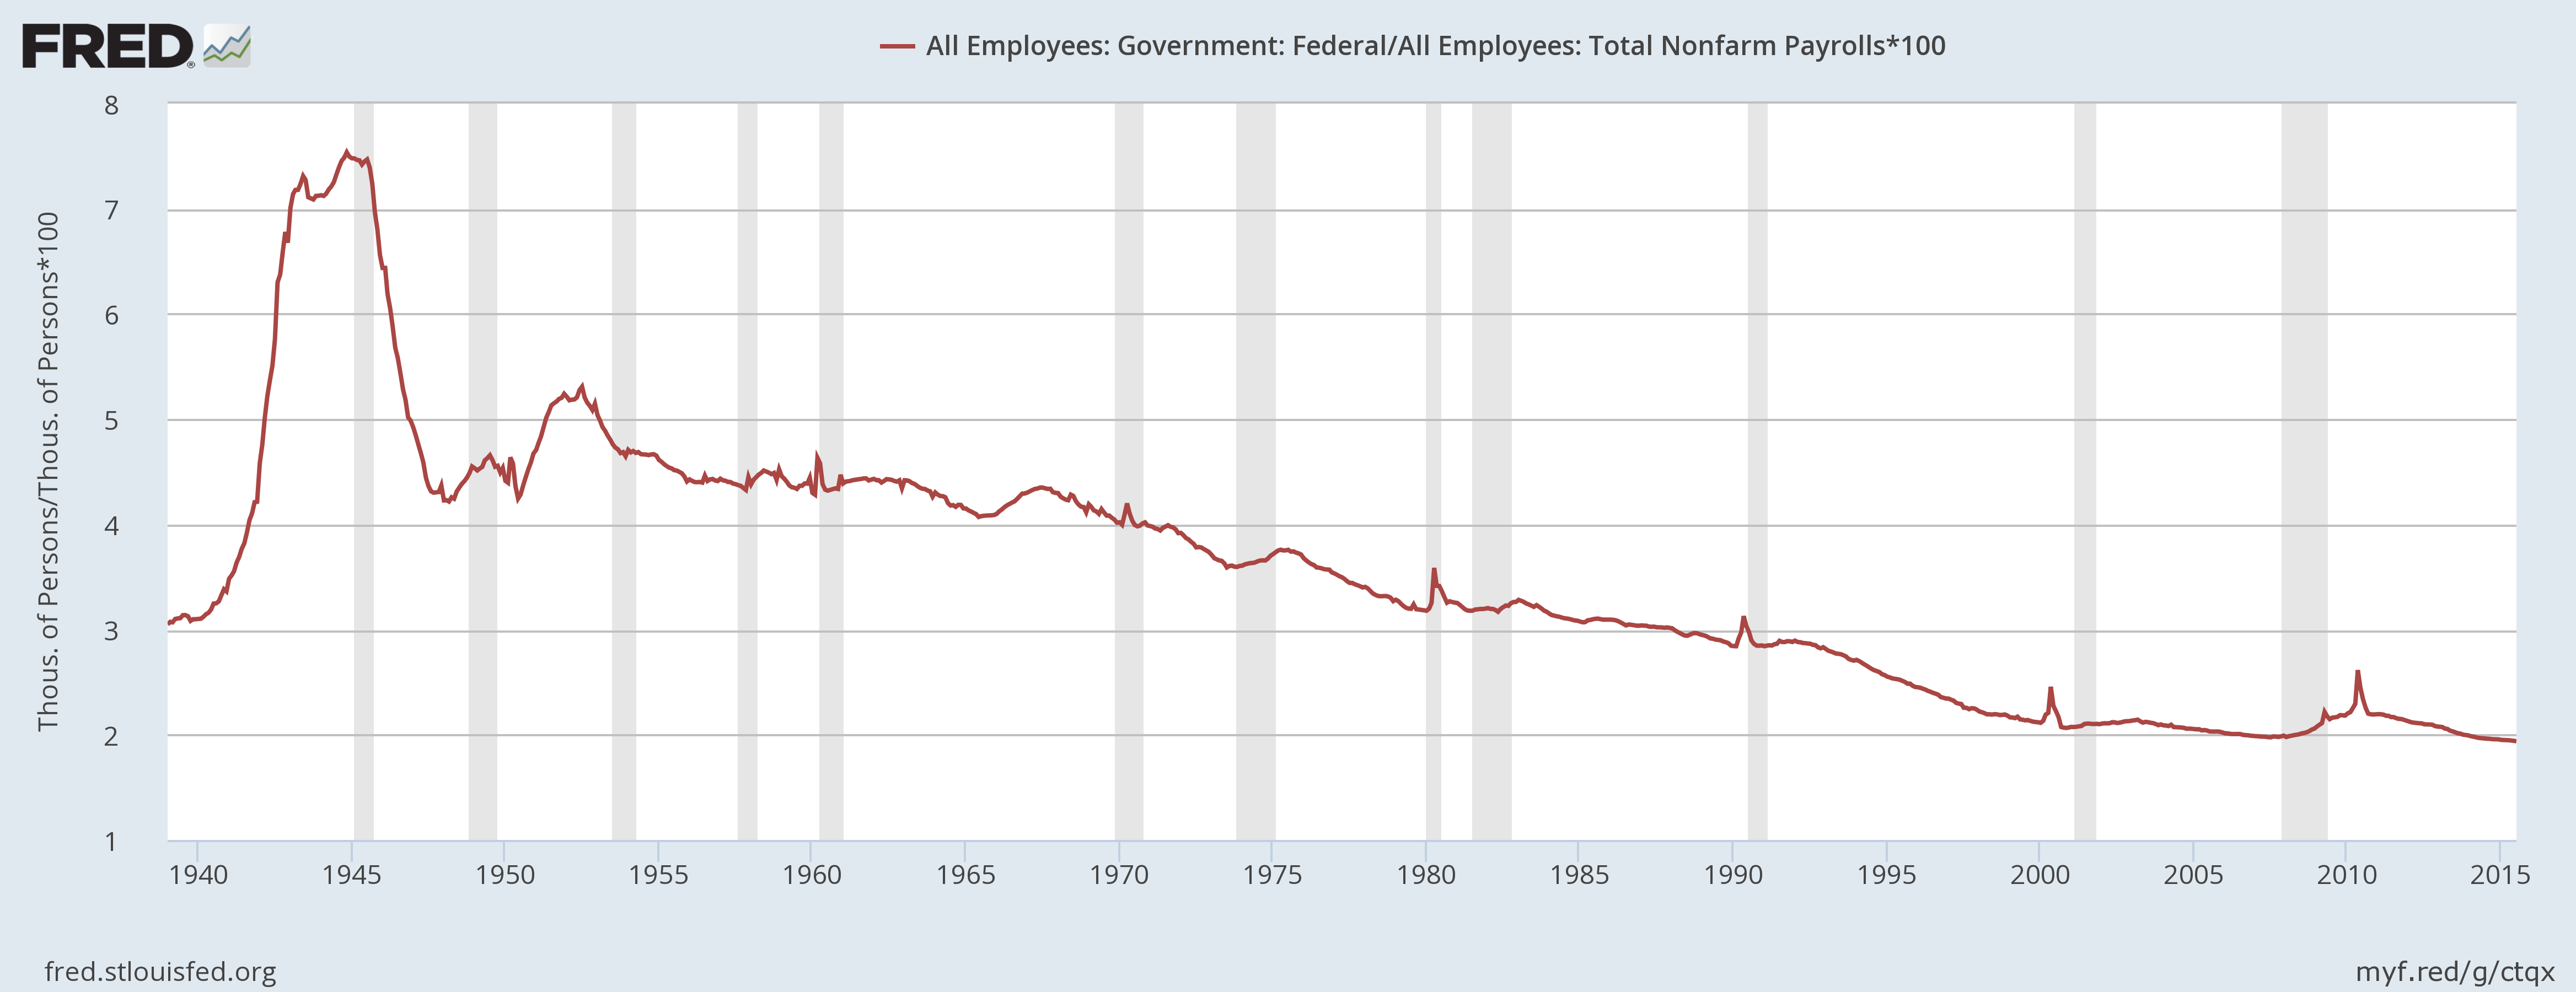
We can also look at the share of government employment in total employment, as suggested here, to better understand government employment in the context of growing population. Here is 100*Federal Government Employees/All Non-Farm Employees (note: vertical axis range is 1 to 6):

Note that in the BLS CES statistics, "Government employment covers only civilian employees; it excludes uniformed members of the armed services." (See their FAQ.)
"Total Executive Branch Civilian Full-Time Equivalent (FTE) Employees (excluding Postal Service)" 1981-2017, in thousands. 2016 and 2017 numbers are estimates.
Year    Total   DoD     Civilian Agencies
1981    2,109   947     1,162
1982    2,074   978     1,096
1983    2,074   983     1,091
1984    2,083   999     1,083
1985    2,112   1,029   1,084
1986    2,113   1,041   1,071
1987    2,105   1,032   1,073
1988    2,109   1,007   1,102
1989    2,129   1,023   1,106
1990    2,174   1,006   1,168
1991    2,112   969     1,143
1992    2,169   973     1,196
1993    2,139   932     1,207
1994    2,052   868     1,184
1995    1,970   822     1,148
1996    1,891   779     1,112
1997    1,834   746     1,088
1998    1,790   707     1,082
1999    1,778   681     1,097
2000    1,814   660     1,153
2001    1,737   650     1,087
2002    1,756   650     1,106
2003    1,826   649     1,177
2004    1,821   650     1,171
2005    1,830   653     1,177
2006    1,833   662     1,171
2007    1,832   659     1,173
2008    1,875   671     1,204
2009    1,978   703     1,275
2010    2,128   741     1,386
2011    2,102   771     1,331
2012    2,091   765     1,326
2013    2,058   738     1,320
2014    2,033   724     1,310
2015    2,042   725     1,317
2016    2,106   738     1,368
2017    2,137   733     1,404


