Summary
Yes, the issue of Peak Oil remains an imminent concern. I look at the evidence for this, and discuss why the mainstream is unconcerned.
Scenarios
Oil is ultimately a finite resource that depletes with usage, and production must necessarily peak at some point.
There are three potential scenarios for Peak Oil:
A peak occurs due to physical resource constraints and is close enough to occurring that we will not be prepared for it and it should be a great current concern (the viewpoint of people raising the issue of Peak Oil such as ASPO, the Energy Watch Group and the Hirsch Report).
A peak is not really discussed, with the assumption that it is far enough away from occurring that it is not a current concern. There is no need to try and predict the date of the peak or discuss any mitigation at this time. (the mainstream view)
A peak will occur, but not due to supply limits, but because oil has been replaced painlessly in the marketplace - for example electricity from renewables is powering a transportation system based on electricity that has become cheaper than our oil-based one. So demand for oil peaks before oil production hits physical limits. This view is based on the economic principle of a substitution good. . However, there is no single substitution good proposed in this case that would replace oil. (An economists view and also what Hubbert believed in March 1956 when he first presented his paper titled Nuclear Energy and the Fossil Fuels, which was the first time the issue of Peak Oil was raised. His replacement for oil, coal and natural gas was nuclear energy (and an implied new transportation infrastructure))
The "Doomsayers"
The advocates of the Scenario 1 are a small disparate group, although retired petroleum geologist Colin Campbell founded the Association for the Study of Peak Oil and Gas (ASPO) in 2000 to study the issue.
Industry View
I am not aware of any of the oil companies, or major investment banks, or governments and their oil-related agencies (such as the US Energy Information Administration (EIA) and the International Energy Agency (IEA)) predicting a peak for which we will not be prepared. They do not advocate Scenario #1.
For example, the International Energy Agency says:
Our analysis suggests there are ample physical oil and liquid fuel
resources for the foreseeable
future.
i.e. the IEA predict Scenario #2, if we assume that the foreseeable future (their graph forecasts only go to 2030), includes enough time to have replacements in place.
The IEA, on the other hand suggests the possibility of Scenario #3 occuring:
A combination of sustained high prices and energy policies aimed at
greater end-use efficiency and diversification in energy supplies
might actually mean that peak oil demand occurs in the future before
the resource base is anything like
exhausted.
Oil industry remains optimistic despite the warning signs.
While the mainstream (and the previous answers to this question on Skeptics.SE) is sanguine, during the period in which ASPO has been in existence, the price of oil has more than tripled in real terms, and has reached the highest inflation-adjusted plateau, if not ever, at least since 1946.
Also during that period, the inflation-adjusted spot price of oil spiked to a level even higher than during the spike of the second oil crisis. Coincident with that spike was the tanking of the OECD economies in the Great Recession. So, prices have risen above previous levels, which per the basic economic principle of supply and demand means that there is less supply with regard to demand then at any time since 1946 (I have not seen data from before that) and/or it has become more expensive to produce oil.
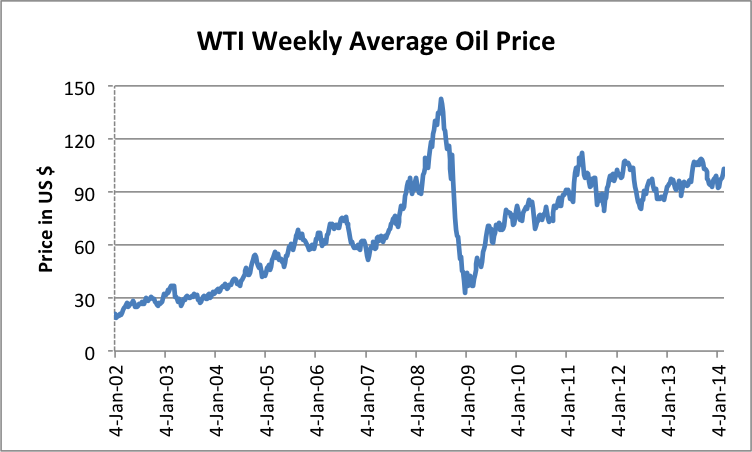
West Texas Intermediate crude oil prices, weekly average 2002-2013
Even without an oil production peak, the price rise suggests problems. The price rise was predicted and easily explained by people advocating Scenario #1. The people supporting Scenario #2 did not predict these prices levels. They have to either concede supply shortages, as the EIA did here in 2007, or they can point to higher costs to obtain oil. But either explanation implies a worsening oil marketplace for consumers. (I don't know if there were people supporting Scenario #3 a decade ago and what they predicted with regard to price)
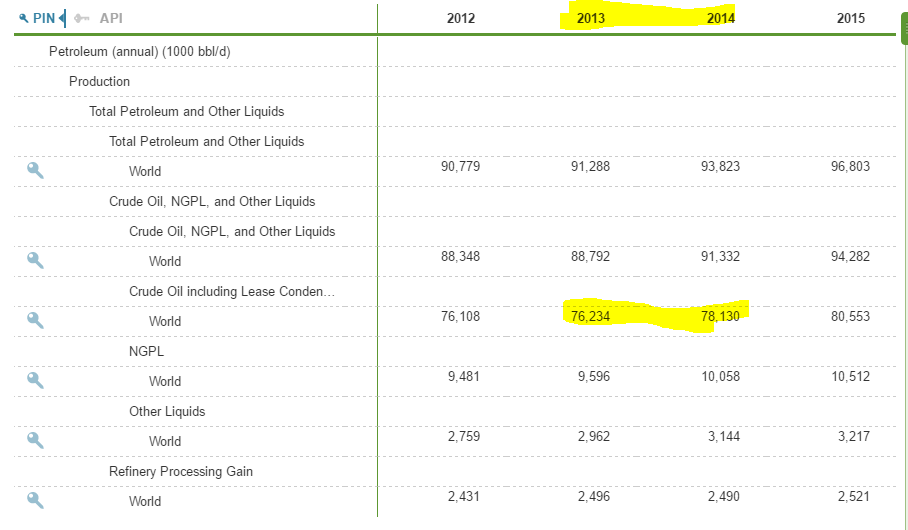
But the oil price rise has not dampened the inherent optimism with regard to the global production of this critical finite depletable resource. Despite the price rise, there has actually been an increase of articles proclaiming the Peak Oil "theory" being dead, mostly dead or slowly dying, spurred on by the production of total liquids production rising above peaks predicted by various Peak Oil proponents.
However, this misplaced optimism can be explained by examining the two different methodologies used to forecast oil production which can lead to two different conclusions.
Evidence for Scenario #1
1. Conventional Oil Has Already Peaked
"Conventional crude oil" is crude oil that is obtained via traditional methods (drill vertically and pump out), and excludes oil obtained from fracking techniques or other non-oil sources (actually total liquids sources) like tar sands or natural gas liquids (NGLs) that are included in world "oil" production figures.
Conventional crude oil production peaked in 2005.
In a recent talk given at Columbia University, Steven Kopits, of Douglas-Westwood, an oil field services consulting company, presented this graph showing the peak of conventional crude oil production.
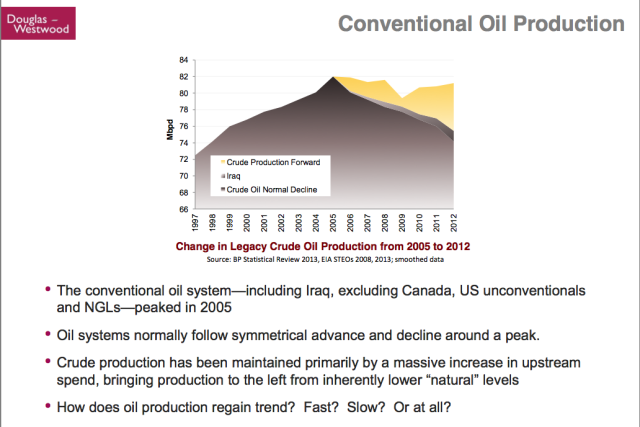
All of the increase that has come since 2005 in world total liquids production (aka total oil production) is from:
- US fracking of tight oil
- NGLs
- Canadian tar sands
The bulk has been from US fracking.
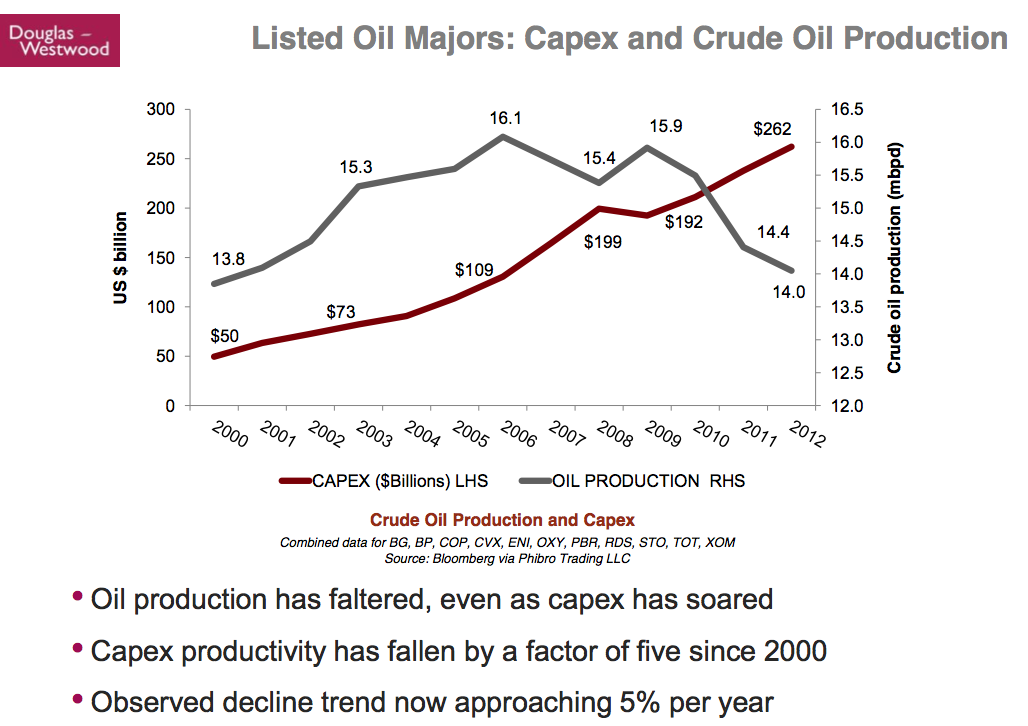
(The next graph below shows the oil production of the major oil companies also peaked in 2005.)
2. Production Costs for Major Oil Companies are Spiralling Up
The major stock exchange listed oil companies are spending much more and not increasing their production significantly.
A second graph from Kopits shows that the oil majors expenses for discovering and producing oil are now over 5 times what they were in 1999, and production is only 1.55% higher.
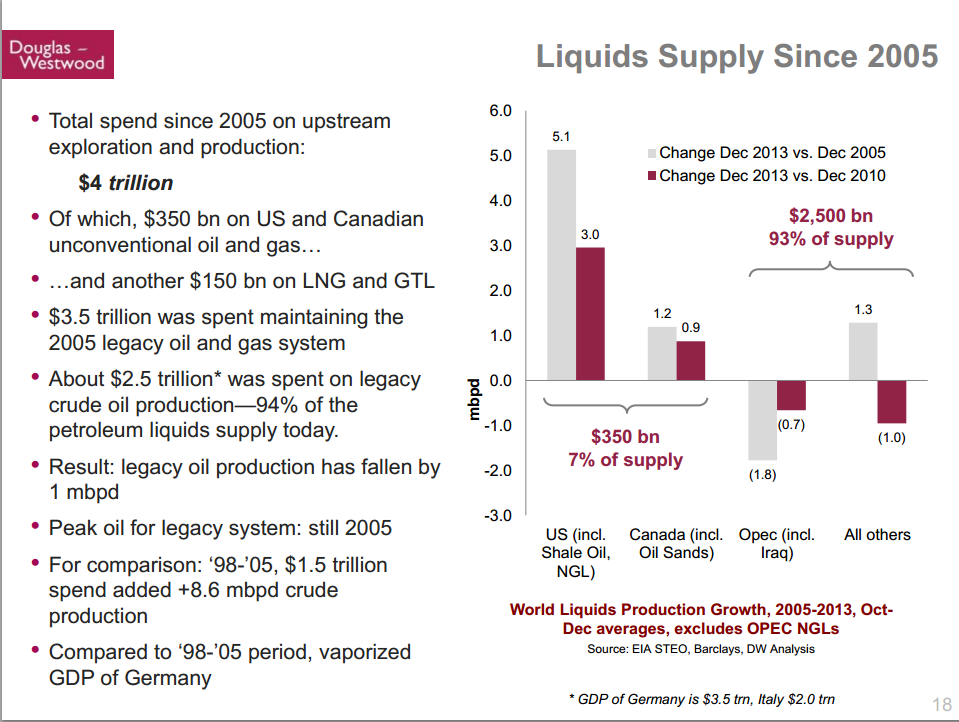
As shown on slide 18 of Kopits' presentation spending to find and produce conventional crude oil (all producers) was 1.5 trillion US dollars from 1998 to 2005 and this resulted in an increase of 8.6 million barrels per day (mbpd). From 2006 to 2013 spending was 2.5 trillion (an increase of 66% over the prior 8 year period) and production decreased by 6%.
The costs of finding and producing oil have become so high that a Goldman Sachs study calculates that nearly half of the oil industry requires oil prices above $120 dollars a barrel in order to achieve positive cash flow and also pay their dividends. This cost problem is having a negative impact on new projects - some are being put on hold, some are being canceled.
3. Oil Production growth has been slower than GDP.
Oil production has slowed from traditional growth rates with respect to GDP growth.
On page 15 of his presentation, Kopits shows that oil supply growth has not matched traditional rates with respect to GDP growth and traditional oil efficiency gains (1.2%). And this slowing started in 2004, 4 years before the great recession of 2008. Did we suddenly voluntarily get more efficient in usage, or were we forced to get more efficient?
Demand-Driven Forecasting Leads To False Optimism
Given this evidence, why are some pundits still optimistic about the dangers of Peak Oil?
Kopits points out at the 04:10 minute mark in his talk that most entities are using Demand Driven or Demand Constraint forecasting, which assumes for an item, that whatever is demanded by consumers, will be produced.
So as I mentioned, this is traditional demand driven forecasting,
everybody uses this, all the investment banks, all the oil majors, the
US and foreign government all use this.
As Kopits details, this forecasting technique that they are using for oil is the same as what they use to forecast car production, or smart phones or any other manufactured item. They start with a forecast percentage change in GDP (from one of the government agencies), then use a ratio (determined from historical observation of GDP and item production) to apply that GDP change to current production of the item in question and get a number for future production. Their forecasts assume that supply will match demand. So the demand for oil drives the production of oil.
When production does not match their forecast of demand, they conclude that their predetermined ratio was wrong - that is, demand now changes less per GDP change than they had previously assumed - and not that supply could not meet demand. Whereas Kopits and his firm (Douglas-Westwood) and Peak Oil proponents are using Supply Driven or Supply Constraint forecasts for oil. They feel that supply cannot meet demand. So they start out by making an estimate of how much oil can be produced and if desired, forecast GDP based on the oil supply prediction and a calculated oil usage efficiency (which improves over time). While this model would not have been applicable in years past, Kopits feels it valid now and has been proven correct in recent years. He tries to demonstrate that Supply Driven is the correct method at this point in time with regard to oil, and one of the things he mentions is that in Demand Driven forecasting, it is believed that the price of an item will rise above the highest cost to produce it. But the oil majors are cutting projects because the oil price has plateaued below the cost required for their new projects.
But the key point is that most oil production forecasters start with an assumption that causes them to not even look for supply problems or predict maximum production rates. It is assumed that whatever is needed will be supplied. If oil production were to decrease, they would believe that it is because oil demand has decreased. If oil production were to peak, they would believe that it was because oil demand has peaked. The demand driven forecasters will focus on reserves. And reserves of unconventional sources with lower flow rates like tar sands or Venezuelan heavy oil can get lumped together with crude oil and published as total reserves, even though they have much different production rates. Steven Kopits and his firm feel that this forecasting method was once valid, but at this point in time, a Supply-Driven forecasting model is the correct one.
Future Supply Growth
The bulk of current total liquids production consists of conventional crude oil. The IEA is predicting that conventional crude oil production will slightly increase for the next 15 years. This would mean a reversal in the small 6% current decline from the 2005 peak. But as noted, the 6% decline came after a 66% increase in spending over the prior 8 year period. Whether we see Peak Oil before 2030 likely hinges on the ability of the world to maintain conventional crude oil production. The Energy Watch Group, in contrast to the EIA, in their March 2013 report titled Fossil and Nuclear Fuels – the Supply Outlook (page 10), show conventional crude oil production in terminal decline through 2030.
The majority of the production increases since the peak of conventional crude oil in 2005 has come from US fracking of tight oil. The US EIA is getting more optimistic with regard to fracking output, seeing a 2 mpbd higher output peak in their 2014 forecast, versus 2013, but both total oil production and tight oil production, are still forecast to peak before 2020. Most of the growth in world "oil" supplies since 2005 has come from US tight oil, and the EIA shows it peaking in five years or less. After 2020 world oil production growth will likely require fracking to begin in other countries. This article cites 175 billion barrels potentially recoverable worldwide, versus the 43 billion in the US. But any gain from fracking or NGLs or tar sands will likely be offset to a greater or lesser extent by continued decreases in conventional crude oil production. It would seem that optimism about future oil production growth into the 2030's is dependent on quick development and output from that 175 billion barrels of "tight oil" worldwide. There is talk of drilling in the arctic for a potential 90 billion barrels of oil, but those projects are currently on ice due to the costs being higher than current oil prices.
Tar sands, due to an energy-intensive mining and conversion process, have limitations with how much they can produce annually. Although Canada is referred to as having a "Saudia Arabia's worth of oil", people are only talking about getting to 5 mbpd, not the 10 mbpd that a Saudi Arabia can produce.
Natural Gas Liquids (which are only partially substitutable for crude oil) are predicted to increase in the future by the IEA. But as with oil, there are predictions of Peak Gas that deviate sharply from more optimistic forecasts from the government agencies.
There is a large amount of heavy crude oil in Venezuela. Like the tar sands of Canada, it was formerly crude oil that has degraded, and suffers from similar limitations as to how much can be produced annually. The IEA, in their WEO 2010 report say that production of heavy oil is 0.7 mpbd and forecast 1.3 mbpd in 2020 and 2 mbpd in 2035. At the present time, both tar sands and heavy crude oil contribute much more to world reserve totals than they do to world production.
As seen in some answers in this page, some oil supply optimists (not necessarily in the profession of forecasting oil production) will even talk about the quantities of kerogen shale (aka oil shale), which has no significant historical production to even ensure its economic viability, let alone calculate its potential flow or production rate.
Future Demand Growth
The two most populated countries on earth (2.64 billion people) have had their economies jump-started by OECD job export, and are now becoming big players in the global energy market. But they are still low on the motorization curve, versus the OECD countries. Even if oil production could continue to grow for a few decades, it would need to grow faster than the increase in usage from these two countries in order to avoid further supply problems and price increases. If it does not exceed their demands, then they will continue to, as Steven Kopits puts it, get much of their oil “from Main Street, USA”. That is, they will bid it away in the marketplace from American and other OECD consumers.
Were Dr. M. King Hubbert's predictions correct?
Assuming you are talking about the date, rather than the issue of oil production reaching a peak worldwide and going into terminal decline, according to a 1974 National Geographic article, Hubbert predicted 1995 as the peak (I have seen somewhere else that he had a secondary date, just as with the US he predicted 1965 as primary and 1971 as secondary [peaked in 1970]) "if present trends continue". The second oil shock of 1979 definitely stopped "present trends" for a decade. Oil usage rather than increasing, actually decreased for 5 years in the aftermath. In a 1976 interview he talks about a 1995 world oil production peak but notes that OPEC countries were “curtailing production somewhat” and said that it was conceivable that “we might extend this by something like 10 years” (“this” being his graph showing an oil production peak in 1995).
So the qualification of his first prediction to Congress in 1974 was not met, and he raised the possibility of a peak as late as 2005, two years later. And as shown above, conventional crude oil peaked in 2005. However, conventional crude oil production has not dropped at the rate that Hubbert was expecting.
However, predicting the date, to me, is like a doctor telling you you have cancer and then predicting when you will die from it. Does missing the date change the overriding fact that you have cancer? Can you be sanguine if the problem remains, but a date was missed? Does Hubbert predicting 1995, 21 years earlier change the issue of the peaking in production of a finite depletable resource that has been used to great extent for a century?
One thing that isn't well known is that Hubbert had something in common with some of the optimists of today. There has been some increasing talk of the economic idea of substitution with regard to oil - something will be - painlessly - substituted for oil and other fossil fuels. His paper which first talked about Peak Oil was actually titled Nuclear Energy and the Fossil Fuels and. Past examples of substitution are coal for wood and oil for whale oil. Hubbert felt that over time nuclear power would increase and replace oil, coal and natural gas.


