Just wondering if this claim is true,

Picture reads,
There are fewer AMERICANS in the labor force today than anytime since 1979!! LIKE and SHARE this if Americans need more OPPORTUNITY!
Just wondering if this claim is true,

Picture reads,
There are fewer AMERICANS in the labor force today than anytime since 1979!! LIKE and SHARE this if Americans need more OPPORTUNITY!
The claim is false.
You can get historical labor force numbers from here: http://www.bls.gov/webapps/legacy/cpsatab1.htm
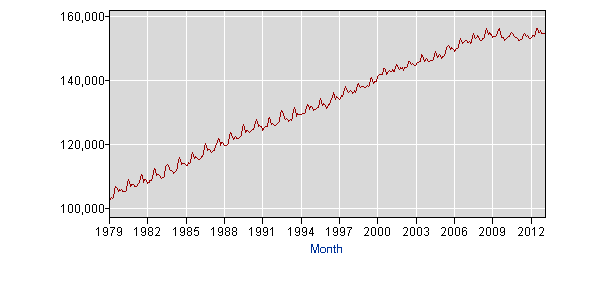
If you request the total civilian labor force, not seasonally adjusted, from 1979 to 2013, you get:
The graph looks like this (y-axis is in 1000s of people):

If the claim is from any time later than 1980, it is false. The image is stamped with "Generation Opportunity", which didn't exist before 2010, so we can assume this is a recent claim.
The one possible shortcoming of this analysis is that the claim says "Americans" but these numbers represent the total US civilian workforce, including non-Americans. However, in 2011, Department of Homeland Security reported that there were approximately 13.1 million legal permanent residents ("green card" recipients) living in the United States. Subtracting those 13.1 million non-Americans from the 2010 or 2013 counts, that would still leave more Americans in the labor force today than the total labor force in 1979.
It may refer to the following
"The portion of Americans working and looking for work fell in March to 63.3% from 63.5%, lowest since 1979"
Since "a portion of" is not the same as "the number of", the claim is not true, but may be based on a related true claim.
The short answer, as Sancho writes, is "No".
The statistic that's being referenced here (to some degree) is the labor force participation rate, which seems to be the percentage of Americans in the labor force, not the absolute number. So it could be correct if
"There are fewer AMERICANS in the labor force today than anytime since 1979!!"
were changed to
"There is a smaller percentage of AMERICANS in the labor force today than anytime since 1979!!"
To see a graph of this, throw "labor participation rate of usa" into Wolfram Alpha. And I'm sure there are plenty of caveats to go around about how the labor participation rate deals with infants and the infirm, for instance.