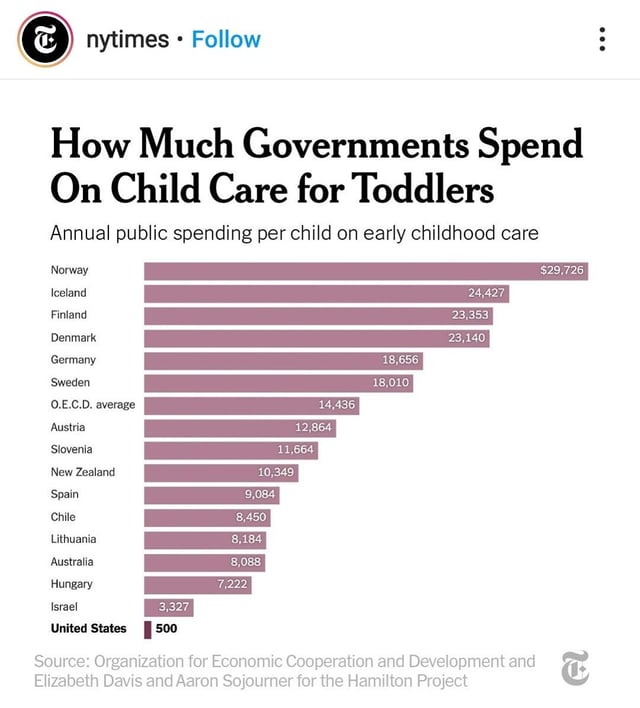
I would like to verify the following chart (e.g. take Norway) in a New York Times article:
(Note that multiple references in the article appear to define a toddler as being 0-2 years of age. They say "Denmark, for example, spends $23,140 annually per child on care for children 2 and under," which matches their graph.)
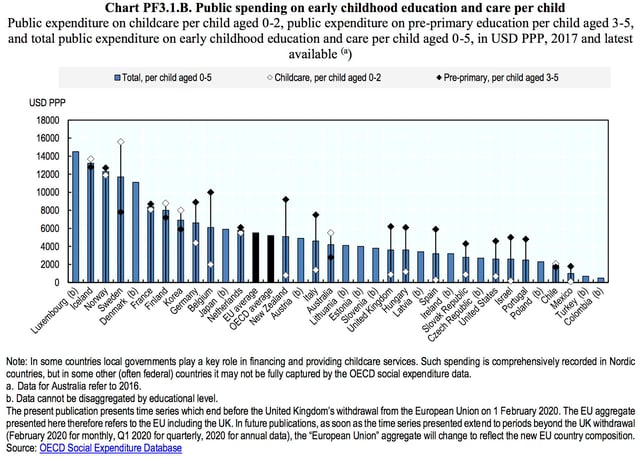
Looking through OECD links and searching their website, I found this OECD article updated September 2021:
The graph says Norway spends $11,900 PPP adjusted on child care per toddler (an excel file can be downloaded from the article for the exact numbers on the graph).
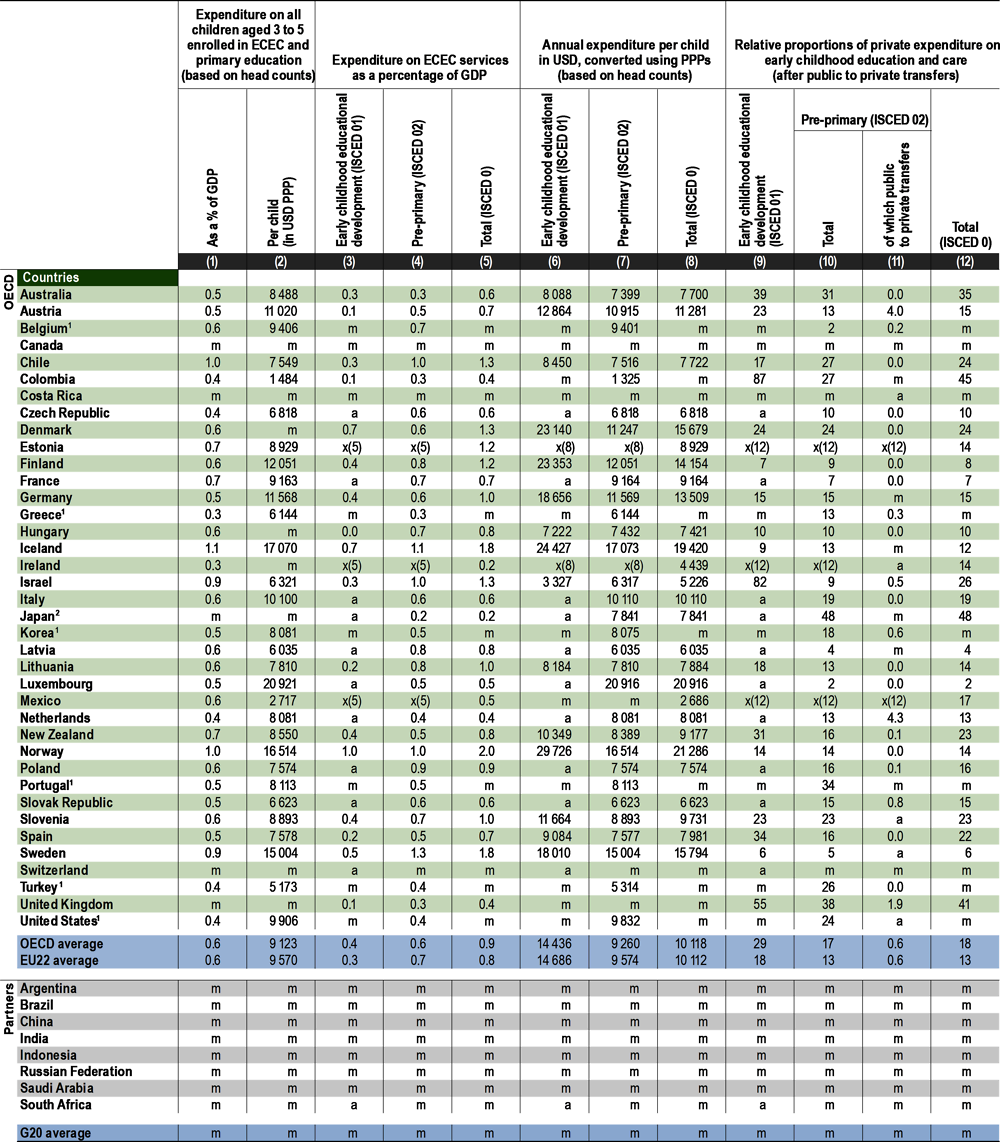
There is no reason for this $11,900 statistic to substantially disagree with the NYT's $29,726 except if the units disagree. The NYT could be using nominal instead of PPP adjusted dollars, and they could define children differently (e.g. is it per child enrolled or just living in the country). Neither of these explanations seem to work.
We can try to unadjust from PPP to nominal using the OECD PPP index, the max value for Norway since 2017 is 154 over 100. Thus, the maximum nominal amount I could reasonably get for Norway is: $11,900 X 1.54 = $18,326 nominal child care per toddler.
The enrollment rate interpretation does not work because it balloons the US number into the few thousands.
The reasoning in the article suggests they might have used spending as a percent of GDP to somehow get their number. However, I can't find the relevant calculations anywhere, e.g. at The Hamilton Project mentioned in their chart's source. Given the $11,900 PPP per child statistic directly from the OECD, I can't see how the NYT chart could possibly be correct?
Is anyone able to verify the $29,726 number or show how the NYT's calculated it--and comment on its correctness?
(Ideally, this verification would be based on OECD sources since that's the source in the NYT graphic. Of course, any answers that might shed light are welcome.)


