50

There is an article, that has been circulating the past two days, entitled: Is There a Pandemic?

In the abstract the author gives her method:

However, only 32 weeks have elapsed in 2020. For each previous year, 52 weeks have already elapsed. How then can we compare deaths from all causes in 2020 to previous years? In this paper, I divide total deaths by number of weeks to arrive at number of deaths per week for each of the last 21 years, January 1, 2000 through August 8, 2020.

And comes to the conclusion:

The US Centers for Disease Control (CDC) lists total deaths for many previous years. The CDC also provides number of deaths from all causes in 2020. On examination of the data for the first two decades of the 21st century in this paper, it is seen that the 2020 weekly total death rate in the US is the lowest in a decade, and second lowest in the 21st century so far.

It seems that she also posted a tweet, that has now been removed(?).

Her rhetoric seems to be all quite anti-masks, anti-social distancing, etc; she really misses living in a free country, as well.

Seems like someone is really trying to push a narrative but I'm not sure that there's any real substance to it.

Ideas?

3
  • 35
    Irony: the linked page in the question is flagged as unsafe by my anti-virus software. Commented Aug 15, 2020 at 17:07
  • 54
    Oddly, there is no need to calculate the monthly death rates for previous years based on annual total. The CDC publish this data openly so a precise seasonal comparison can be made. So it looks like an amateur attempt was made to work something out by someone completely unfamiliar with the actual data.
    – matt_black
    Commented Aug 15, 2020 at 22:28
  • 2
    I haven't read the study, but comparing a weekly average with a sample set of a full year vs the weekly average of a partial year is already not apples to apples. The method used fails to correct the issue they claim other evaluations are causing.
    – Logarr
    Commented Aug 17, 2020 at 19:47

3 Answers 3

88

It appears that the study by Colleen Huber, NMD, a Naturopathic Medical Doctor, cited in the OP is incomplete, and was subsequently withdrawn on 13 August, 2020.

The NYT article, 13 August 2020, appears to sharply contradict the doctor's study and conclusions.

The True Coronavirus Toll in the U.S. Has Already Surpassed 200,000
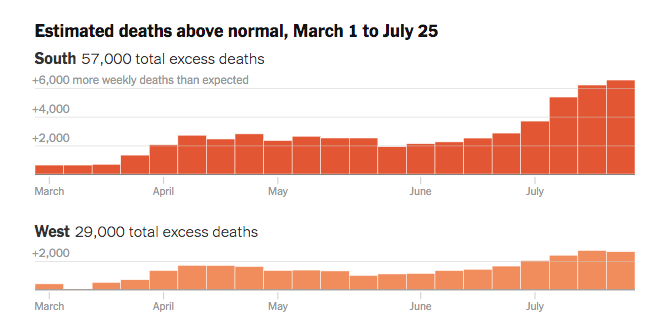
Charts, March to late July, showing 57,000 and 29,000 total excess deaths in the South and West respectively

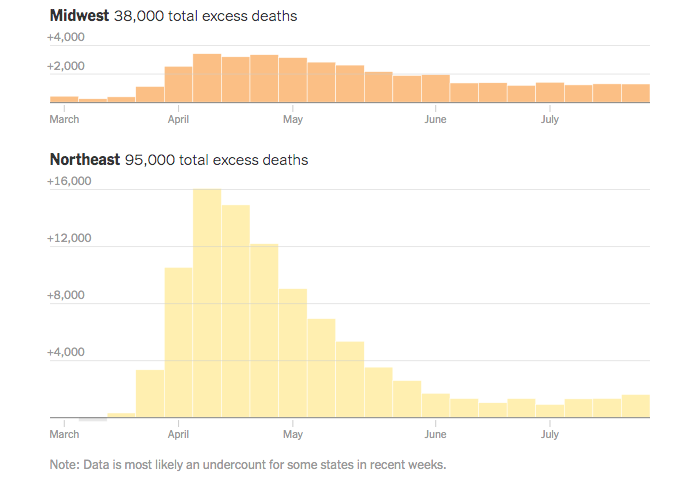
Charts, March to late July, showing 38,000 and 95,000 total excess deaths in the Midwest and Northeast respectively

Across the United States, at least 200,000 more people have died than usual since March, according to a New York Times analysis of estimates from the Centers for Disease Control and Prevention. This is about 60,000 higher than the number of deaths that have been directly linked to the coronavirus. As the pandemic has moved south and west from its epicenter in New York City, so have the unusual patterns in deaths from all causes. That suggests that the official death counts may be substantially underestimating the overall effects of the virus, as people die from the virus as well as by other causes linked to the pandemic.

[…]

Weekly deaths above normal in each state

The charts below show how much higher than usual weekly deaths have been in each state. States with the most recent peaks — the week when they saw the most excess deaths during the pandemic — appear first. For each state, weeks in which data may be incomplete are excluded.

The US city with the highest peak of COVID-19 mortality is New York City. As seen below, the number of deaths was 7.7x above that of the average weekly death rate on April 5. On the same day, excluding the city of NY, the death toll in the state of New York was 2.4 times higher than average.

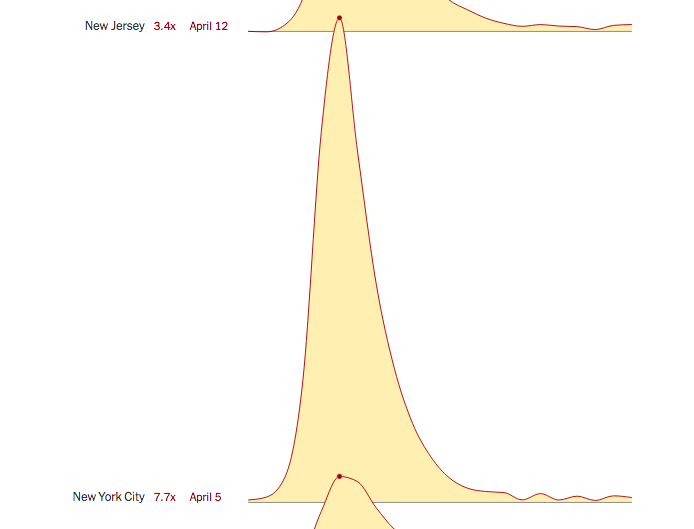
graph displaying months March to August 2020 graph illustrating the sharp rise of mortality in NYC, in April 2020, and the subsequent fall in deaths from May onward

It is clear from the tweets and the number of papers published on PrimaryDoctor.Org that the author of the now-withdrawn paper, Colleen Huber, NMD, is a fierce opponent to social distancing and the wearing of masks. In a paper entitled, Proof: Lockdowns Did Not Reduce Deaths, published in June 16, 2020, Doctor Huber argued

[emphasis in bold, mine]

States without lockdown, herein “free states,” have had a lower percentage than states with lockdown, herein “locked states,” of total deaths from all causes in these weeks in 2020, compared to the same weeks for each of the states in the years 2017 to 2019.

[…]

Lockdowns were imposed by many jurisdictions for the stated purpose of limiting movement, activities and commerce of individuals and businesses, for the goal of limiting COVID-19 incidence and mortality. It was widely hoped this would work. However, outside of the US, it was found that mortality actually increased steeply closely following lockdowns.(3) Also, it was found that in Europe, “no lives were saved” by lockdown.(4) In an early analysis in the US also, it was not found that lives were saved by shutdown.(5) Those last two analyses were relatively early, 4/24 and 4/26/20 respectively, before it was clear that COVID-19 incidence, hospitalizations and deaths had peaked.

The same doctor also tweeted this missive earlier today.

No, fascists Biden and Harris:
You cannot mandate #masks. They have been proven to be a health hazard, and you cannot mandate a health hazard. Here's the proof: Masks are neither effective nor safe: A summary of the science
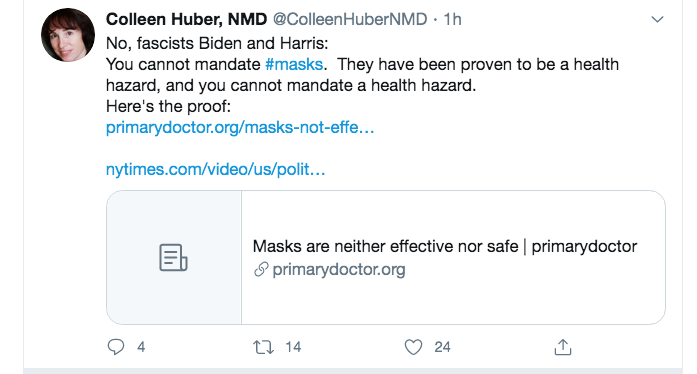
Twitter post

From that tweet alone, it would suggest that the doctor's paper and the analysis of the data is one of confirmation bias. However, to her credit, the paper is no longer viewable, as researchers pointed out that she had missed certain data on the CDC website. “My paper may have to be revised, and my revised paper will appear here when ready.”

Further references:

Are deaths of patients with, but not because of, COVID-19 recorded as COVID-19 deaths in the USA?

As of May 2020, are there twice as many deaths from Covid-19 in New York City as there are on a usual day from all other causes combined?

23
  • 7
    Unless you make it clear what the last para about 'missive' should say in the context of this question or how it connects, this seems like 'unrelated' (I guess you want to express: 'person has sinned before and sinned again, so as a source for anything is untrustworthy'? But that is a weak argument in itself, and as a kind of ad hominem (which might indeed be relevant here – although, based on the first very good ref Cochrane/Jefferson on the target page, I'd probably disagree about the quality) needs a better connection to the mainQ. ) I#ll suggest to either remove or increase relevance. Commented Aug 15, 2020 at 17:45
  • 15
    @LangLаngС It's connected because the Tweet is by the same doctor who argued that there is/was no pandemic. It appears that Dr. Huber is fiercely opinionated, and does not support the concept of social distancing or the wearing of masks to lower the number of infections. This probably explains why Huber conducted and published the study.
    – Mari-Lou A
    Commented Aug 15, 2020 at 17:54
  • 43
    You can't have it both ways. Either there are more deaths now, or there are fewer. If there are fewer deaths this year (in which people are wearing masks) than last year (in which people were not wearing masks), then by Huber's correlation = causation BS, masks save lives. And I guess since people who use insulin die of diabetes at a higher rate than those who don't, insulin causes diabetes? Commented Aug 16, 2020 at 0:09
  • 11
    @Mari-LouA Sorry, I should have been more clear. I was referring to the Huber. She's trying to argue that the correlation between lockdowns and deaths implies causation, but is also claiming that there are fewer deaths in 2020 than 2019, which would mean that when looked at by year, there's a negative correlation. Commented Aug 16, 2020 at 6:29
  • 11
    Considering the bogus spreaded by her, I'd call her a lot of names that are more unfriendly than doctor. NDs have a tendency to read different books than an MD does and to answer the real question, NDs aren't licensed for medical practice everywhere while MDs are. I think the current count is 16 states, a third of the states at most.
    – Mast
    Commented Aug 16, 2020 at 9:21
53

No.

Sanity check:

The CDC has provisional weekly death data for 2019 and 2020 available here: https://data.cdc.gov/NCHS/Weekly-Counts-of-Deaths-by-State-and-Select-Causes/muzy-jte6.

The average number of deaths per week in July 2019 was ~52,000.

The average number of deaths per week in July 2020 was ~54,500.

These figures suggest that the weekly mortality rate is not the lowest in a decade - it was lower last July.

Analysis of the article:

Note that the author has retracted this article: https://www.primarydoctor.org/is-there-a-pandemic. The retraction commentary suggests this is because Huber has been made aware of new data that impacts the results.

However, even without new data, the article is substantially flawed because is misinterprets the sources of data that it does use.

For 2020, Huber uses 1,627,731 deaths as the total number of deaths in the first 32 weeks of 2020 (up to 8 Aug 2020). This is a value from the 10 Aug 2020 update of the CDC's "Provisional Death Counts for Coronavirus Disease 2019" page (archive link from 11 Aug 2020).

However, that value is in fact the total number of deaths over the weeks ending 1 Feb 2020 to 8 Aug 2020 (as clearly indicated on that page), not the total number of deaths from the beginning of the year to 8 Aug 2020.

As a result, Huber's denominator of 32 weeks is incorrect - it should be 28.

Huber makes the same mistake when using the data from 29 May 2020.

Therefore, the correct conclusion is that there were fewer deaths in the weeks ending 1 Feb 2020 to 8 Aug 2020 than from the start of the year to 8 Aug in prior years, which is not a particularly useful comparison, since people die in January too (in fact, generally more people die in the U.S. in January than in any other month).

I have not reviewed each of the article's references, but the first reference on the article has also been retracted: https://www.npr.org/sections/health-shots/2020/03/26/822084429/in-defense-of-coronavirus-testing-strategy-administration-cited-retracted-study.

Actual data:

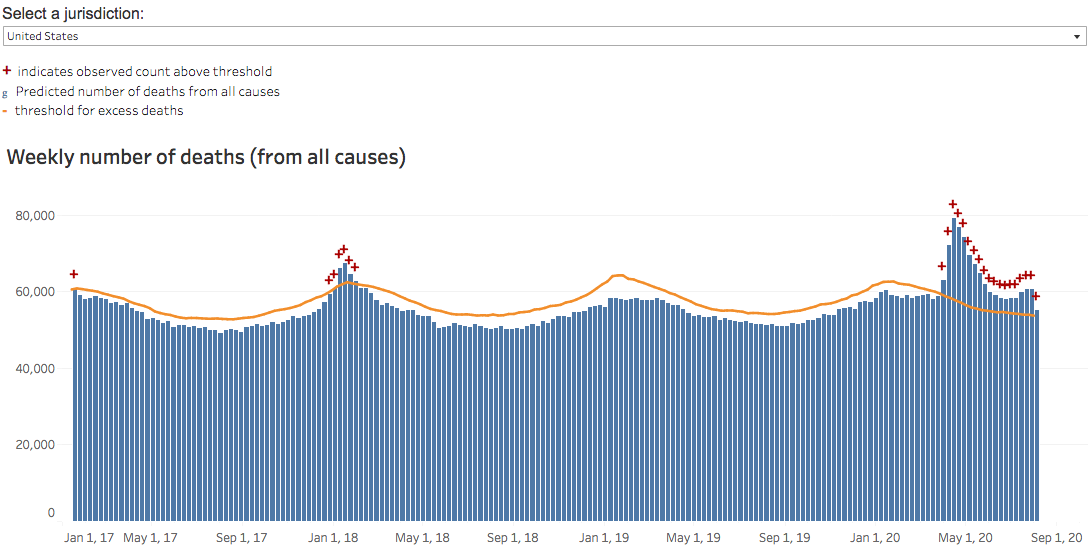
The CDC has an excess deaths dashboard available, comparing all-cause observed weekly deaths with expected weekly deaths (based on historical trends). This dashboard indicates that the U.S. has had more deaths per week than expected for each week since late March. See https://www.cdc.gov/nchs/nvss/vsrr/covid19/excess_deaths.htm.

screenshot of CDC excess deaths dashboard

7
  • 14
    Let's also add the fact that most reporting has a significant lag. From the CDC page you linked to: "Data are incomplete because of the lag in time between when the death occurred and when the death certificate is completed, submitted to NCHS and processed for reporting purposes. This delay can range from 1 week to 8 weeks or more, depending on the jurisdiction and cause of death. See cdc.gov/nchs/nvss/vsrr/COVID19/index.htm for more information". And also "Data for New York excludes New York City".
    – jcaron
    Commented Aug 16, 2020 at 13:42
  • 2
    Good point about the lag. re "Data for New York excludes New York City", I think that just means that NYC and the rest of NY are treated as separate jurisdictions in that dashboard.
    – andars
    Commented Aug 16, 2020 at 15:57
  • Why is it that the 'predicted number of deaths from all causes' is so significantly below the 'threshold for excess deaths' for the last few years Commented Aug 16, 2020 at 21:53
  • @Adam I presume it is taking into consideration margin of error Commented Aug 16, 2020 at 22:29
  • 1
    Welcome to the site, andars. We're glad you decided to participate. I appreciate that your post is clear, concise, and organized.
    – user11643
    Commented Aug 17, 2020 at 20:24
14

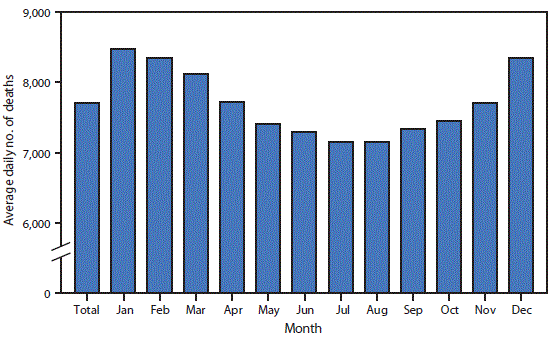
It looks like they are trying to push a narrative just as you suspect. If you look at the data they provide from the CDC it quickly becomes clear that the death rate is not steady all year long and it peaks in winter and declines to the lowest in summer. Because of this it is clear to see that doing a straight average is not a fair comparision.

https://www.cdc.gov/mmwr/volumes/68/wr/mm6826a5.htm

It should be noted that the chart below lists the daily death rate average which appears to vary by over 1000 deaths a day or 30,000 deaths in a month

2017 Monthly Death Graph

This is also discounting the fact that the social distancing and mask wearing policies has an impact on the death rate in other ways. One of that is in the Southern Hemisphere there is new reporting that this years flu season has been drastically reduced in potency and health officials are suspecting that it is due to the new rules that are in place.

Southern Hemisphere Flu Season

Countries in the Southern Hemisphere are reporting lower numbers of flu cases this year compared with previous years—and health officials are attributing the decline to widespread coronavirus restrictions such as mask wearing, travel restrictions, and social distancing.

Just with these two facts I think it is hard to say that the death rate is lower this year and there is no pandemic.

2
  • 2
    A little ambiguous. Who is "they" in your first line? NYT or Huber?
    – BobT
    Commented Aug 15, 2020 at 20:49
  • 7
    @BobT A little confused on what you are saying, as I thought it was pretty clear that "they" is referring to the the person who wrote the article in question. I don't have any links to the NYT in my answer so not sure how it could refer to that.
    – Joe W
    Commented Aug 15, 2020 at 21:32

You must log in to answer this question.

Not the answer you're looking for? Browse other questions tagged .