The original source of the quote is
Corman, H. and Mocan, N., 2005. Carrots, sticks, and broken windows. Journal of Law and Economics, 48(1), pp.235-266. URL - requires subscription
or potentially an earlier version of this paper,
Corman, H. and Mocan, N., 2002. Carrots, sticks and broken windows (No. w9061). National Bureau of Economic Research. URL - no subscription required
They model the crime rate in NYC over the period 1974-1999 as a function of economic indicators, demographics, and deterrence measures, including:
- unemployment rate *
- real minimum wage *
- felony arrests *
- number of NYC residents incarcerated in state correctional facilities *
- size of the NYC police force *
- number of misdemeanor arrests ("broken window" policing) *
- number of 14–17-year-olds in NYC
- seasonality
and try to quantify the impact of each of the variables marked with a * on felony crime rate. (Other potential contributing factors are not considered.) They find that their model explains "about one-third to all of the observed decline in index crime in NYC between 1990 and 1999" (depending on the specific crime), and that the deterrence measures have a greater effect than the economic indicators.
The quote in your question comes from two sections of the paper (emphasis mine):
Increases in the real minimum wage are found to significantly reduce robberies, murders, and grand larcenies, and higher unemployment is significantly related to increased burglaries and motor vehicle thefts. Thus, although it is not always the same economic indicator, there is evidence that economic conditions affect all felony crimes except assault and rape.
and later,

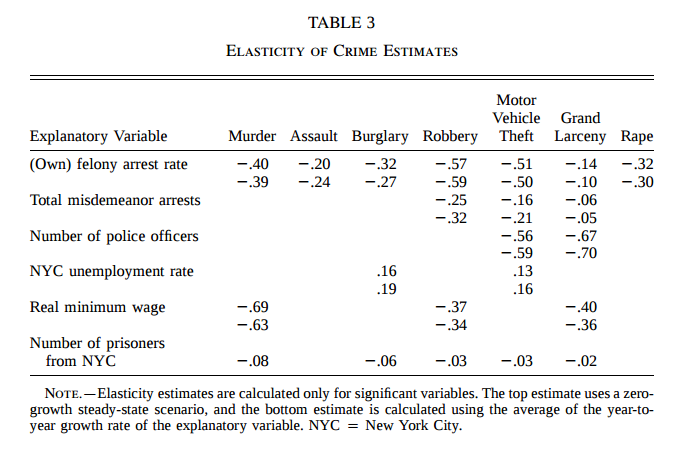
Table 3 includes elasticities only for statistically significant variables. The first row in each column reports the elasticity calculated using a zero-growth steady-state scenario for the variables in the system. The elasticities reported in the second row are calculated using the average of the year-to-year growth rates of the explanatory variables. Table 3 demonstrates, for example, that a 10 percent increase in the murder arrest rate generates about a 4 percent reduction in murders, and a 10 percent increase in the real minimum wage results in a 6.3–6.9 percent decrease in murders.
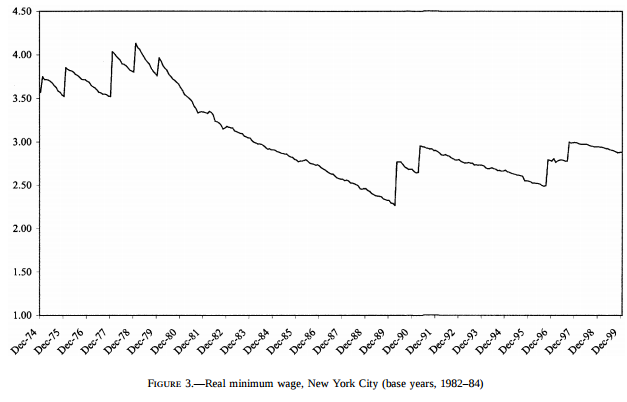
During the period of time included in the study, minimum wage varied as follows:
After an erosion in the value of the minimum wage in 1980s, there were two nominal wage increases in 1990 and 1991, and two other increases were implemented in 1996 and 1997. Overall, the real minimum wage remained rather stable during the 1990s.

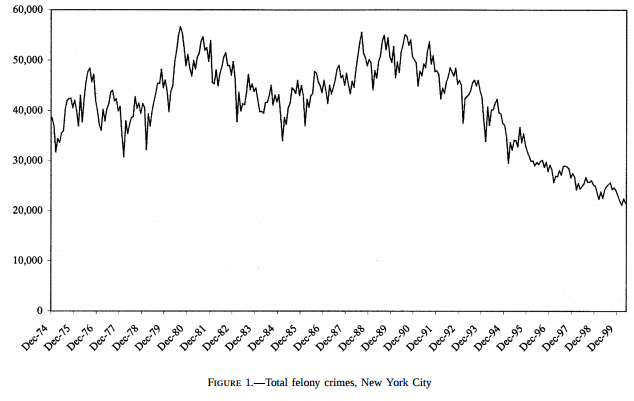
and the number of felony crimes varied as follows:

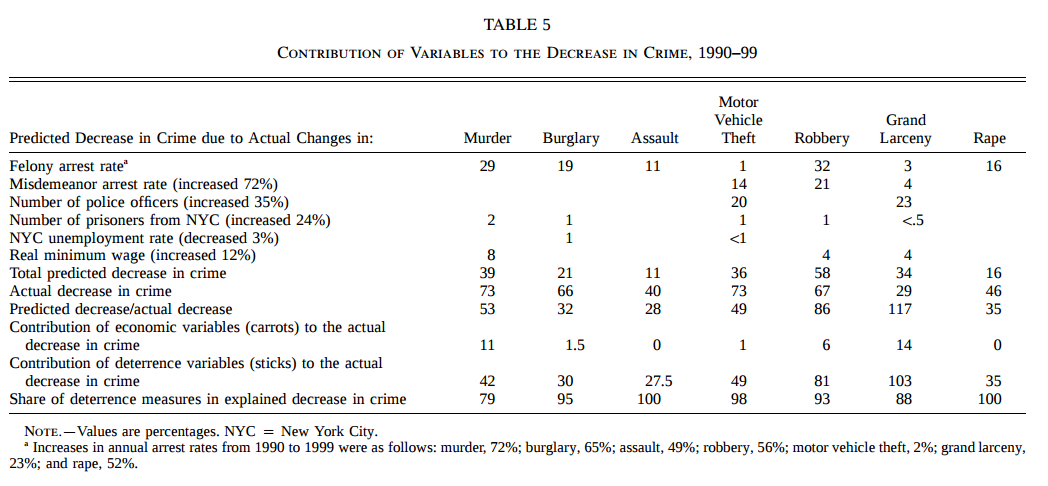
The following table shows the percent change in the number of crimes between 1990 and 1999 attributable to each of the explanatory variables listed above, according to the model:

(Between 1990 and 1999, real minimum wage increased 12%.)


