The RCPs
See http://www.skepticalscience.com/rcp.php?t=3 for a summary of the assumptions behind each of the projections:
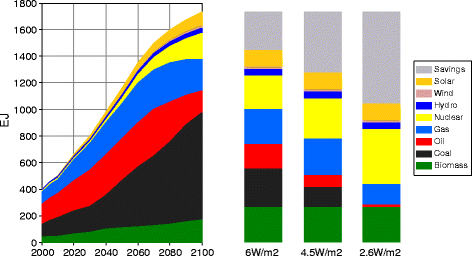
RCP 8.5 was developed using the MESSAGE model and the IIASA
Integrated Assessment Framework by the International Institute for
Applied Systems Analysis (IIASA), Austria. This RCP is
characterized by increasing greenhouse gas emissions over time,
representative of scenarios in the literature that lead to high
greenhouse gas concentration levels (Riahi et al. 2007).
RCP6 was developed by the AIM modeling team at the National Institute
for Environmental Studies (NIES) in Japan. It is a stabilization
scenario in which total radiative forcing is stabilized shortly after
2100, without overshoot, by the application of a range of technologies
and strategies for reducing greenhouse gas emissions (Fujino et al.
2006; Hijioka et al. 2008).
RCP 4.5 was developed by the GCAM modeling team at the Pacific
Northwest National Laboratory’s Joint Global Change Research
Institute (JGCRI) in the United States. It is a stabilization scenario
in which total radiative forcing is stabilized shortly after 2100,
without overshooting the long-run radiative forcing target level
(Clarke et al. 2007; Smith and Wigley 2006; Wise et al. 2009).
RCP2.6 was developed by the IMAGE modeling team of the PBL Netherlands
Environmental Assessment Agency. The emission pathway is
representative of scenarios in the literature that lead to very low
greenhouse gas concentration levels. It is a “peak-and-decline”
scenario; its radiative forcing level first reaches a value of around
3.1 W/m2 by mid-century, and returns to 2.6 W/m2 by 2100. In order to reach such radiative forcing levels, greenhouse gas emissions (and
indirectly emissions of air pollutants) are reduced substantially,
over time (Van Vuuren et al. 2007a). (Characteristics quoted from van
Vuuren et.al. 2011)
The projections
Matt Ridley's assertion that only one of the four scenarios predicts a temperature change of greater than two degrees (above pre-industrial levels) is false.
Table 12.3 of the IPCC makes this explicit. The probability that there will be temperature changes (with reference to the time period 1850-1900) greater than 2°C by the time period 2081-2100 under each of the four models is:
- RCP2.6: 22%
- RCP4.5: 79%
- RCP6.0: 100%
- RCP8.5: 100%
The IPCC report summarizes this as follows:
Based on this assessment, global mean
temperatures averaged in the period 2081–2100 are projected to
likely exceed 1.5°C above 1850-1900 for RCP4.5, RCP6.0 and RCP8.5
(high confidence). They are also likely to exceed 2°C above 1850-1900
for RCP6.0 and RCP8.5 (high confidence) and more likely than not
to exceed 2°C for RCP4.5 (medium confidence). Temperature change
above 2°C under RCP2.6 is unlikely but is assessed only with medium
confidence as some CMIP5 ensemble members do produce a global
mean temperature change above 2°C.
Even comparing against the temperature from 1986-2005 (IPCC Table 12.2), both RCP6.0 and RCP8.0 have mean projected increases by 2081-2100 of 2.2°C and 3.7°C respectively.
Ridley uses inconsistent baselines
I find his comparison to be sloppy science. He mentions how much the models will result in temperatures being "warmer than today". Then, he switches baselines in the next sentence when he says "Now two degrees [above pre-indistrial levels] is the threshold at which warming starts to turn dangerous, according to the scientific consensus."
It is misleading to cite projected differences from today and then compare those differences to a threshold based on differences from pre-industrial temperatures.
He is definitely aware of this baseline discrepancy, because he added the words "[above pre-indistrial levels]" (sic) to the quote when he reproduced it on his blog.


