31

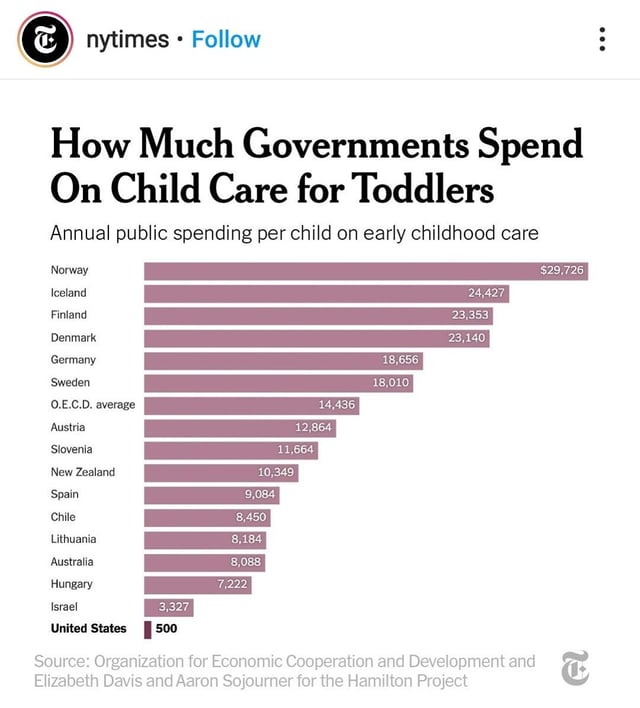
I would like to verify the following chart (e.g. take Norway) in a New York Times article:

(Note that multiple references in the article appear to define a toddler as being 0-2 years of age. They say "Denmark, for example, spends $23,140 annually per child on care for children 2 and under," which matches their graph.)

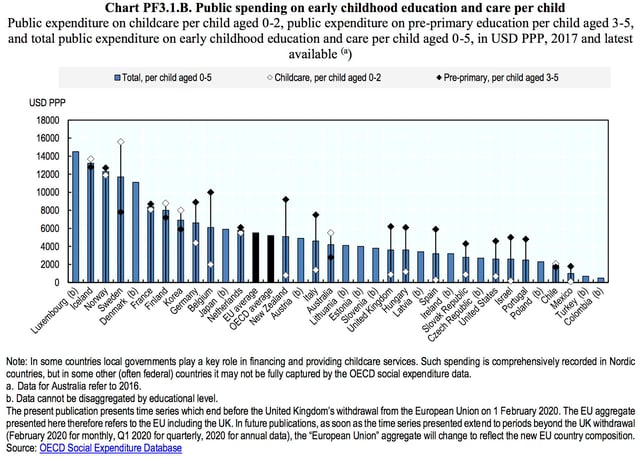
Looking through OECD links and searching their website, I found this OECD article updated September 2021:

The graph says Norway spends $11,900 PPP adjusted on child care per toddler (an excel file can be downloaded from the article for the exact numbers on the graph).

There is no reason for this $11,900 statistic to substantially disagree with the NYT's $29,726 except if the units disagree. The NYT could be using nominal instead of PPP adjusted dollars, and they could define children differently (e.g. is it per child enrolled or just living in the country). Neither of these explanations seem to work.

We can try to unadjust from PPP to nominal using the OECD PPP index, the max value for Norway since 2017 is 154 over 100. Thus, the maximum nominal amount I could reasonably get for Norway is: $11,900 X 1.54 = $18,326 nominal child care per toddler.

The enrollment rate interpretation does not work because it balloons the US number into the few thousands.

The reasoning in the article suggests they might have used spending as a percent of GDP to somehow get their number. However, I can't find the relevant calculations anywhere, e.g. at The Hamilton Project mentioned in their chart's source. Given the $11,900 PPP per child statistic directly from the OECD, I can't see how the NYT chart could possibly be correct?

Is anyone able to verify the $29,726 number or show how the NYT's calculated it--and comment on its correctness?

(Ideally, this verification would be based on OECD sources since that's the source in the NYT graphic. Of course, any answers that might shed light are welcome.)

17
  • 1
    Does the NYT article explain, which agegroup they mean by toddler? Their 500$ for the US suggests 0-2 but that still doesn't match with Norway. Their ordering of the expensive countries is also different from your OECD graph.
    – quarague
    Commented Oct 7, 2021 at 18:25
  • 1
    @quarague Yes, the article seems to define toddler as 0-2: "Denmark, for example, spends $23,140 annually per child on care for children 2 and under," which matches their graph. There are multiple other references to the 0-2 year old range, though they don't explicitly say that toddler is defined as that. (I'll edit the post to define toddler.) Commented Oct 7, 2021 at 18:29
  • 5
    Another factor to consider: What exactly is "child care"? Are we talking a normal, healthy child or a special needs child? Is perhaps one number with some special-needs expenses mixed in while the other is not? Commented Oct 7, 2021 at 21:39
  • 7
    Not clear to me why you find that incredible. It's not far from the number reported for other Nordic countries. What is more incredible is the US number. A good question would have been if the methodology used for European countries and the US was the same. From what I recall there's years worth of maternity leave in the Nordic countries, which is probably supported by the state even if channeling the money via the employer. Commented Oct 7, 2021 at 23:53
  • 6
    Does this include child tax credit, extra earned income tax credit, tax deductions per child, WIC, CHIP, and other child-related public expenditures?
    – shoover
    Commented Oct 8, 2021 at 4:23

3 Answers 3

26

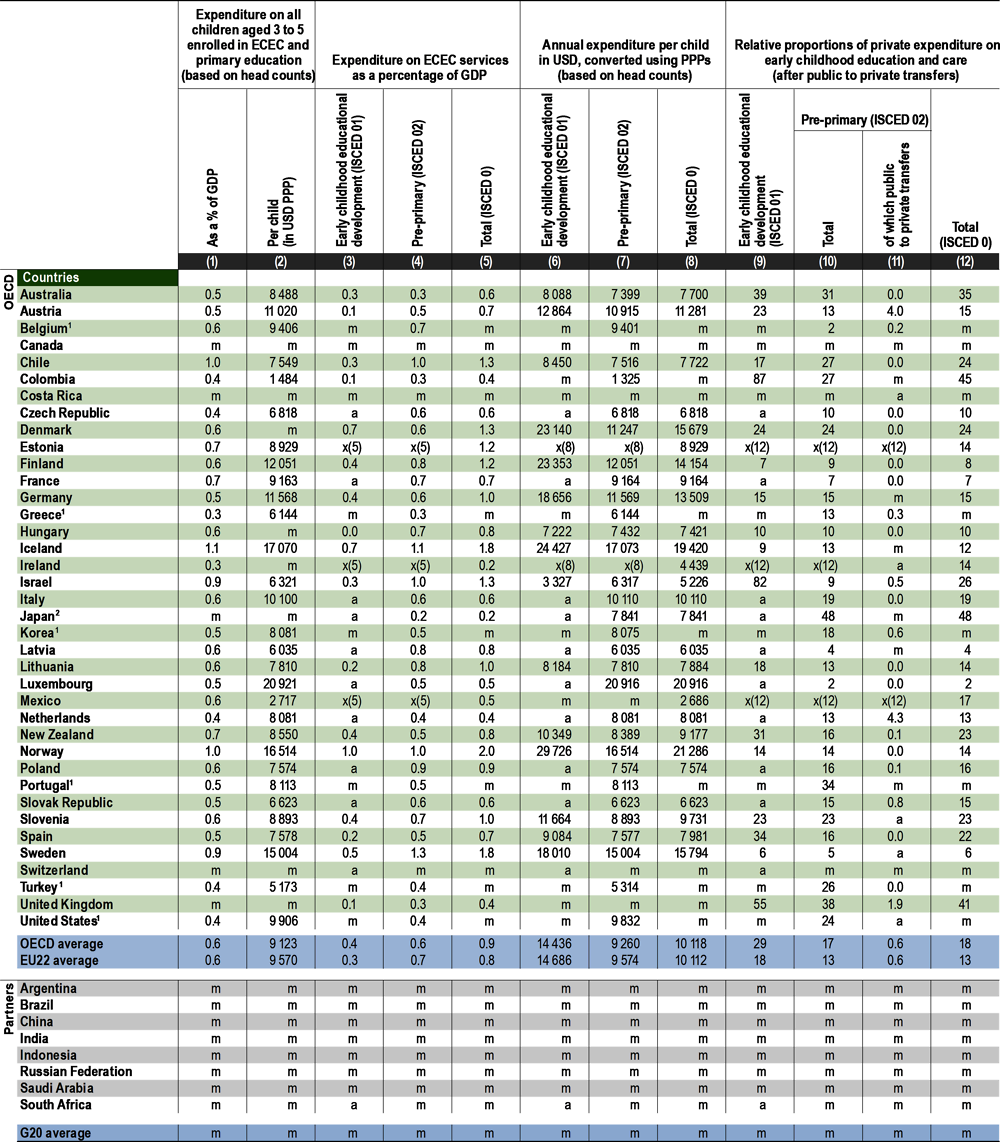
Following the Organisation for Economic Cooperation and Development (OECD) links in the story, these numbers appear to be not generated by the New York Times, but straight from OECD's "Indicator B2. How do early childhood education systems differ around the world?"

See column 6 in Table B2.3 "Financing of early childhood education and care (ISCED 0) and change in expenditure (2018)" (from How do early childhood education systems differ around the world?)

Financing of early childhood education and care (ISCED 0) and change in expenditure (2018)

OECD's methodology for deriving those numbers is explained in "ANNEX 3: SOURCES, METHODS AND TECHNICAL NOTES" of Education at a Glance 2021, which credits some Norway-specific figures to Statistics Norway.

That table lists Norway's annual expenditure per child for "Early childhood educational development" as $29,726.

OECD countries
Australia 8 088
Austria 12 864
Belgium m
Canada m
Chile 8 450
Colombia m
Costa Rica m
Czech Republic a
Denmark 23 140
Estonia x(8)
Finland 23 353
France a
Germany 18 656
Greece m
Hungary 7 222
Iceland 24 427
Ireland x(8)
Israel 3 327
Italy a
Japan a
Korea m
Latvia a
Lithuania 8 184
Luxembourg a
Mexico m
Netherlands a
New Zealand 10 349
Norway 29 726
Poland a
Portugal m
Slovak Republic a
Slovenia 11 664
Spain 9 084
Sweden 18 010
Switzerland a
Turkey m
United Kingdom m
United States m
OECD average 14 436
EU22 average 14 686

("a" means "Data are not applicable because the category does not apply." "m" means "Data are not available – either missing or the indicator could not be computed due to low respondent numbers." "x" means "Data are included in another category or column of the table.")

6
  • 3
    It's also worth noting from the previous table B2.2 that only about half the children in Norway are enrolled in such programs. The figure in B2.3 is almost certainly per enrolled child. Commented Oct 8, 2021 at 0:51
  • 14
    Finally, the USA data in B2.3 is simply missing (for ages 0-2). The NYT probably fumbled here by reporting data on something else as that $500 for the USA in their comparative graph. For USA ages 3-5 it was $9832 in that B2.3, which is a lot higher than $500. Commented Oct 8, 2021 at 1:02
  • 2
    Great, this is clearly where the numbers came from. I have a couple clarifying questions about this chart with respect to column 6. (1) Is this all public and private spending, or is it only government spending on public and private institutions? (2) Is this per enrolled student as @Fizz suggests--it says based on "head counts?" (Dividing the numbers in the PF3.1.B chart I had by enrollment actually gets close to the NYT numbers, it just is not consistent with the US numbers.) (3) This is PPP? I know it says it, but I'm just surprised because then the nominal numbers are even higher. Commented Oct 8, 2021 at 3:34
  • 1
    That table is very hard to read on certain devices. Can you extract the information (for Norway at least) and include it as text in the answer?
    – Laurel
    Commented Nov 30, 2023 at 16:22
  • 1
    @Laurel I've added the relevant columns with a table using Markdown coding. I see some supplementary links have already gone dead in the two years since the answer was first posted. Commented Nov 30, 2023 at 19:03
20

As I suspect this is your real question, the NYT graph appears flawed as a USA vs Norway comparison in the following sense:

  1. Data for Norway appears pulled from that B2.3 graph in jeffronicus' answer, which is about educational programs, not childcare

ISCED 01 refers to early childhood educational development services, typically aimed at children under age 3. The learning environment is visually stimulating, and the language is rich and fosters self-expression, with an emphasis on language acquisition and the use of language for meaningful communication. There are opportunities for active play so that children can exercise their co-ordination and motor skills under supervision and in interaction with staff.

  1. Also the most reliable indicator in that table B2.3 is for ages 0-5. That figures is used a basis for estimating costs on two subgroups, 0-2 and 3-5

The concepts used to define full-time and part-time participation at other ISCED levels, such as study load, child participation, and the academic value or progress that the study represents, are not easily applicable to ISCED level 0. In addition, the number of daily or weekly hours that represent typical full-time enrolment in an education programme at ISCED level 0 varies widely between countries. Because of this, full-time equivalents cannot be calculated for ISCED level 0 programmes in the same way as for other ISCED levels. For data-reporting purposes, countries separate ISCED level 0 data into ISCED 01 and ISCED 02 by age only, as follows: data from age-integrated programmes designed to include children younger and older than 3 are allocated to levels 01 and 02 according to the age of the children. This may involve the estimation of expenditure and personnel at levels 01 and 02. For more information, see the OECD Handbook for Internationally Comparative Education Statistics (OECD, 2018[16]) and Annex 3 for country-specific notes (https://www.oecd.org/education/education-at-a-glance/EAG2021_Annex3_ChapterB.pdf).

  1. Also note that that figure from B2.3 appears to be per enrolled child. Only about half of Norway's children appear to be enrolled in such programs per previous table B2.2.

  2. Finally, the USA data in B2.3 is simply missing for ages 0-2. The NYT probably fumbled here by reporting data on something else (maybe actual childcare) as that $500 for the USA in their comparative graph. For USA ages 3-5 it was $9832 in that B2.3, which is a lot higher than $500.

5
  • 1
    Thanks, that's really helpful! Yes, @jeffronicus answered the first part of my question about where the numbers came from. You're answering the second part about whether the NYT used them correctly. It seems that if we're doing per child enrolled, then the US number of $700 in PF3.1.B would probably need to be scaled significantly? (At odds with the $500 number.) Similar to your point (4), the NYT chart seems to be doing a bit of an apples to oranges comparison. A last question, do you know if column 6 of table B2.3 is government spending or total spending as a whole? Commented Oct 8, 2021 at 3:52
  • 1
    @SherwinLott: on last issue: it's both public and private, there are some columns (9-10) to the right how much of that is private. Seemingly 14% in Norway and 24% in USA is private. Commented Oct 8, 2021 at 3:54
  • 12
    Instead of the rather confusing NYT piece, it is however fair to say that the US spends less (by any number of measures... per GDP or per child) on preschool americanprogress.org/issues/early-childhood/reports/2013/05/02/… Commented Oct 8, 2021 at 4:07
  • 1
    Actually worth noting from the latter piece "Expenditures for federally funded Head Start programs, which provide more than just preschool services, are approximately the same amount per pupil—$8,369 in 2009—although Head Start reaches a very small share of U.S. children." I'm guessing the $9832 reported for USA ages 3-5 in the more recent OECD data (B2.3) is basically that figure updated for later years. Commented Oct 8, 2021 at 4:14
  • 6
    As an American living in Norway with children, it absolutely feels right the Norway spends significantly more in the 0-5 range than the US. There just isn't really any way to compare fully since the systems are fundamentally different. So all comparisons will always feel apples-to-oranges, because they are in many ways apples-and-oranges. Commented Oct 8, 2021 at 15:22
5

My TLDR conclusions from the answers are that: Norway (government and private) spends $29,726 PPP adjusted on child care per enrolled toddler annually. This applies to all other countries with entries in Table B2.3, which notably does not include the US. The US number appears to be government spending per toddler (not necessarily enrolled).

Private spending in Norway is 14% (after public transfers), so Norwegian government spending per enrolled toddler is $29,726 x (1-.14) = $25,564. To be comparable with the US number, we should also either scale up the US number or down the Norwegian number based on enrollment. The Norwegian enrollment rate is .573, so the Norwegian government spends $25,564 x .573 = $14,648 PPP adjusted per toddler (not necessarily enrolled) annually.

It should be emphasized that the gist of the chart/article is obviously true: the US government spends dramatically less than other OECD countries on toddler care.

Thanks to @jeffronicus for finding OECD Table B2.3 with the numbers in the NYT chart. @Fizz provides good analysis of the table and the chart.

You must log in to answer this question.

Not the answer you're looking for? Browse other questions tagged .